106 Roberts Rd Englewood Cliffs, NJ 07632
Estimated Value: $3,572,000 - $4,047,559
7
Beds
8
Baths
6,006
Sq Ft
$646/Sq Ft
Est. Value
About This Home
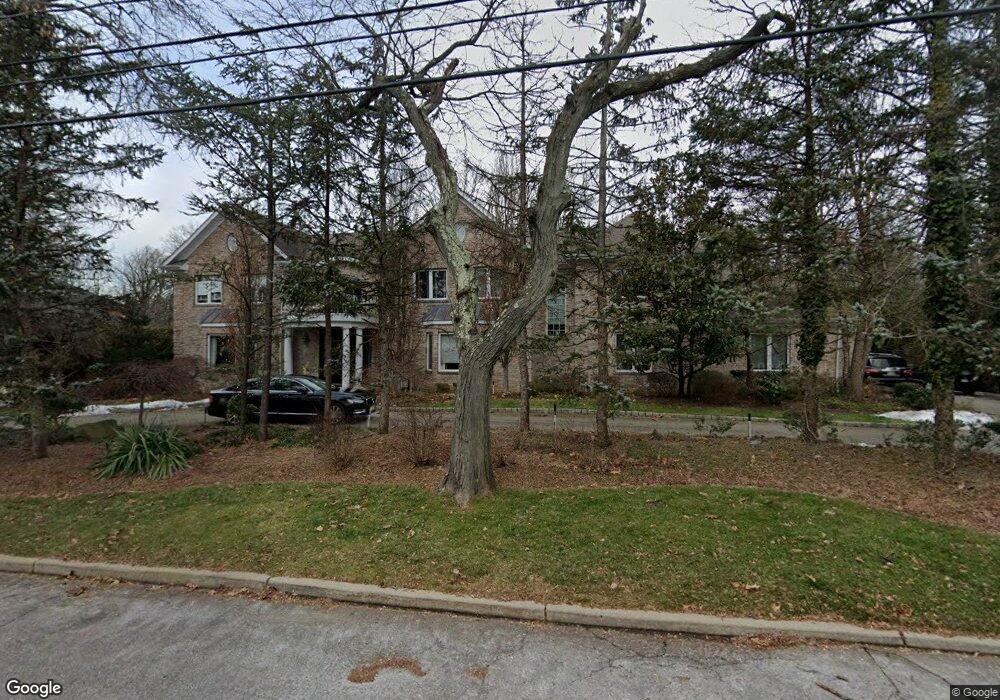
This home is located at 106 Roberts Rd, Englewood Cliffs, NJ 07632 and is currently estimated at $3,881,186, approximately $646 per square foot. 106 Roberts Rd is a home located in Bergen County with nearby schools including North Cliff Elementary School, Upper School Elementary School, and Englewood on the Palisades Charter School.
Ownership History
Date
Name
Owned For
Owner Type
Purchase Details
Closed on
Jun 5, 2018
Sold by
Farber Rhoda and Farber Stewart A
Bought by
Pasternak Kenneth and Pasternak Dorothy
Current Estimated Value
Purchase Details
Closed on
Jul 29, 2001
Sold by
Arturi Emanuel
Bought by
Farber Rhoda
Home Financials for this Owner
Home Financials are based on the most recent Mortgage that was taken out on this home.
Original Mortgage
$1,000,000
Interest Rate
7.1%
Purchase Details
Closed on
Sep 16, 1998
Sold by
Fss Construction Co Inc
Bought by
Arturi Emanual and Arturi Marie
Purchase Details
Closed on
Jan 6, 1997
Sold by
Rubin Earl
Bought by
Fss Construction Co Inc
Create a Home Valuation Report for This Property
The Home Valuation Report is an in-depth analysis detailing your home's value as well as a comparison with similar homes in the area
Home Values in the Area
Average Home Value in this Area
Purchase History
| Date | Buyer | Sale Price | Title Company |
|---|---|---|---|
| Pasternak Kenneth | $2,688,888 | -- | |
| Farber Rhoda | $2,300,000 | -- | |
| Arturi Emanual | $1,900,000 | First American Title Ins Co | |
| Fss Construction Co Inc | $700,000 | -- |
Source: Public Records
Mortgage History
| Date | Status | Borrower | Loan Amount |
|---|---|---|---|
| Previous Owner | Farber Rhoda | $1,000,000 |
Source: Public Records
Tax History Compared to Growth
Tax History
| Year | Tax Paid | Tax Assessment Tax Assessment Total Assessment is a certain percentage of the fair market value that is determined by local assessors to be the total taxable value of land and additions on the property. | Land | Improvement |
|---|---|---|---|---|
| 2025 | $30,113 | $2,607,200 | $1,425,000 | $1,182,200 |
| 2024 | $29,748 | $2,607,200 | $1,425,000 | $1,182,200 |
| 2023 | $29,279 | $2,607,200 | $1,425,000 | $1,182,200 |
| 2022 | $29,279 | $2,607,200 | $1,425,000 | $1,182,200 |
| 2021 | $22,507 | $2,607,200 | $1,425,000 | $1,182,200 |
| 2020 | $30,009 | $2,607,200 | $1,425,000 | $1,182,200 |
| 2019 | $34,586 | $3,199,400 | $1,425,000 | $1,774,400 |
| 2018 | $33,370 | $3,199,400 | $1,425,000 | $1,774,400 |
| 2017 | $31,930 | $3,199,400 | $1,425,000 | $1,774,400 |
| 2016 | $31,322 | $3,199,400 | $1,425,000 | $1,774,400 |
| 2015 | $29,754 | $3,199,400 | $1,425,000 | $1,774,400 |
| 2014 | $27,835 | $3,199,400 | $1,425,000 | $1,774,400 |
Source: Public Records
Map
Nearby Homes