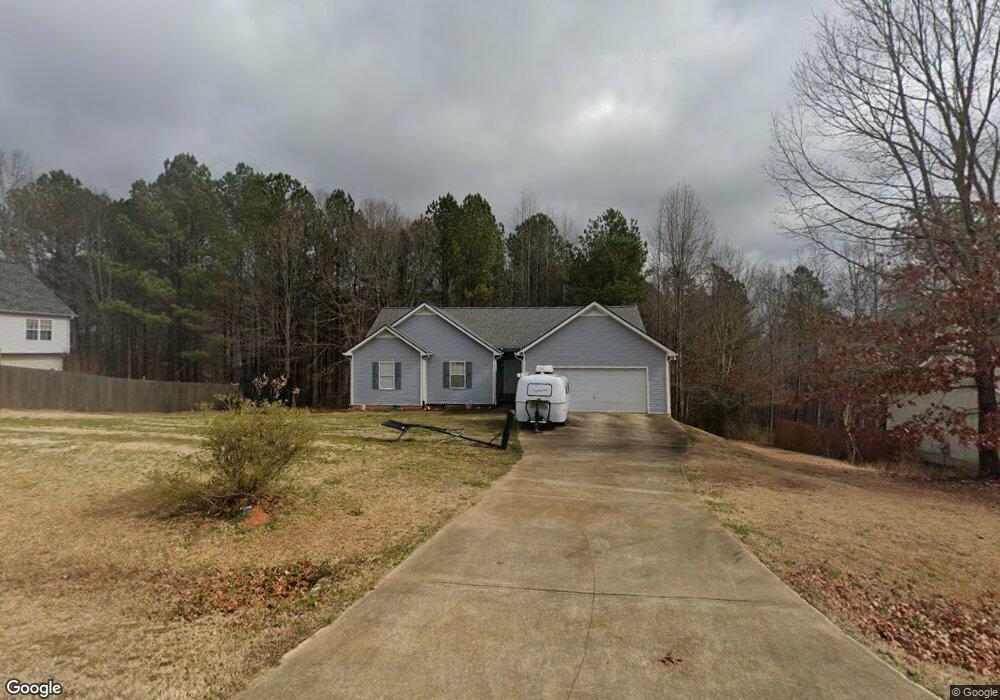
106 Robindale Ln Temple, GA 30179
Estimated Value: $257,000 - $276,000
3
Beds
3
Baths
1,485
Sq Ft
$182/Sq Ft
Est. Value
About This Home
This home is located at 106 Robindale Ln, Temple, GA 30179 and is currently estimated at $270,021, approximately $181 per square foot. 106 Robindale Ln is a home located in Carroll County with nearby schools including Providence Elementary School, Temple Middle School, and Temple High School.
Ownership History
Date
Name
Owned For
Owner Type
Purchase Details
Closed on
Oct 30, 2008
Sold by
Jp Morgan Mtg Acquisition
Bought by
Zehr Kelly E and Zehr Darrin J
Current Estimated Value
Home Financials for this Owner
Home Financials are based on the most recent Mortgage that was taken out on this home.
Original Mortgage
$92,310
Outstanding Balance
$59,927
Interest Rate
6.11%
Mortgage Type
New Conventional
Estimated Equity
$210,094
Purchase Details
Closed on
May 6, 2008
Sold by
Moore Angie
Bought by
Us Bank National Association
Purchase Details
Closed on
Sep 9, 2005
Sold by
Mercury Homes Inc
Bought by
Moore Angie
Purchase Details
Closed on
Feb 10, 2003
Sold by
Citizens Bank & Trust Of Ga
Bought by
Mercury Homes Inc
Purchase Details
Closed on
Sep 3, 2002
Sold by
Rkw Properties Inc
Bought by
Citizens Bank & Trust Of Ga
Purchase Details
Closed on
Aug 2, 2001
Sold by
P & B Land Group Inc
Bought by
Rkw Properties Inc
Purchase Details
Closed on
Oct 25, 2000
Bought by
P & B Land Group Inc
Create a Home Valuation Report for This Property
The Home Valuation Report is an in-depth analysis detailing your home's value as well as a comparison with similar homes in the area
Home Values in the Area
Average Home Value in this Area
Purchase History
| Date | Buyer | Sale Price | Title Company |
|---|---|---|---|
| Zehr Kelly E | $90,500 | -- | |
| Us Bank National Association | $95,920 | -- | |
| Moore Angie | -- | -- | |
| Mercury Homes Inc | $23,000 | -- | |
| Citizens Bank & Trust Of Ga | $25,000 | -- | |
| Rkw Properties Inc | $20,500 | -- | |
| P & B Land Group Inc | -- | -- |
Source: Public Records
Mortgage History
| Date | Status | Borrower | Loan Amount |
|---|---|---|---|
| Open | Zehr Kelly E | $92,310 |
Source: Public Records
Tax History
| Year | Tax Paid | Tax Assessment Tax Assessment Total Assessment is a certain percentage of the fair market value that is determined by local assessors to be the total taxable value of land and additions on the property. | Land | Improvement |
|---|---|---|---|---|
| 2025 | $2,143 | $124,214 | $8,000 | $116,214 |
| 2024 | $2,167 | $124,214 | $8,000 | $116,214 |
| 2023 | $2,167 | $114,378 | $8,000 | $106,378 |
| 2022 | $1,817 | $93,370 | $8,000 | $85,370 |
| 2021 | $1,426 | $69,063 | $8,000 | $61,063 |
| 2020 | $1,325 | $63,348 | $8,000 | $55,348 |
| 2019 | $1,252 | $58,930 | $8,000 | $50,930 |
| 2018 | $1,164 | $53,317 | $8,000 | $45,317 |
| 2017 | $1,166 | $53,317 | $8,000 | $45,317 |
| 2016 | $1,167 | $53,317 | $8,000 | $45,317 |
| 2015 | $935 | $37,427 | $8,000 | $29,427 |
| 2014 | $939 | $37,427 | $8,000 | $29,427 |
Source: Public Records
Map
Nearby Homes
- 101 Robindale Ln
- 133 Pebblebrook Way
- 139 Clover Ct
- 147 Camp Godwin Rd
- 180 Labelle Rd
- 118 Raven Rd
- 122 Wesley Chapel Ln
- 1021 Cown Rd
- 18 Holder Rd
- 100 Gordons Lake Dr
- 223 Sunlight Cove
- 0 Old Draketown Trail (5 62 Ac) Unit 293
- 21 + - Acres On Allgood Church Rd
- 0 Old Draketown Trail (5 62 Ac) Unit 10711831
- 480 Taylors Gin Rd
- 604 Meadows Ct
- 380 River Trace Dr
- 732 Newport Dr
- 102 Pine Bark Dr
- 425 Little Mac Ln
- 112 Robindale Ln
- 163 Greentree Trail
- 118 Robindale Ln
- 107 Robindale Ln
- 191 Greentree Trail
- 113 Robindale Ln
- 166 Greentree Trail Unit 94
- 119 Robindale Ln
- 124 Robindale Ln
- 209 Greentree Trail
- 172 Greentree Trail
- 178 Greentree Trail
- 160 Greentree Trail
- 184 Greentree Trail
- 125 Robindale Ln
- 154 Greentree Trail
- 217 Greentree Trail
- 190 Greentree Trail
- 130 Robindale Ln
- 148 Greentree Trail
Your Personal Tour Guide
Ask me questions while you tour the home.