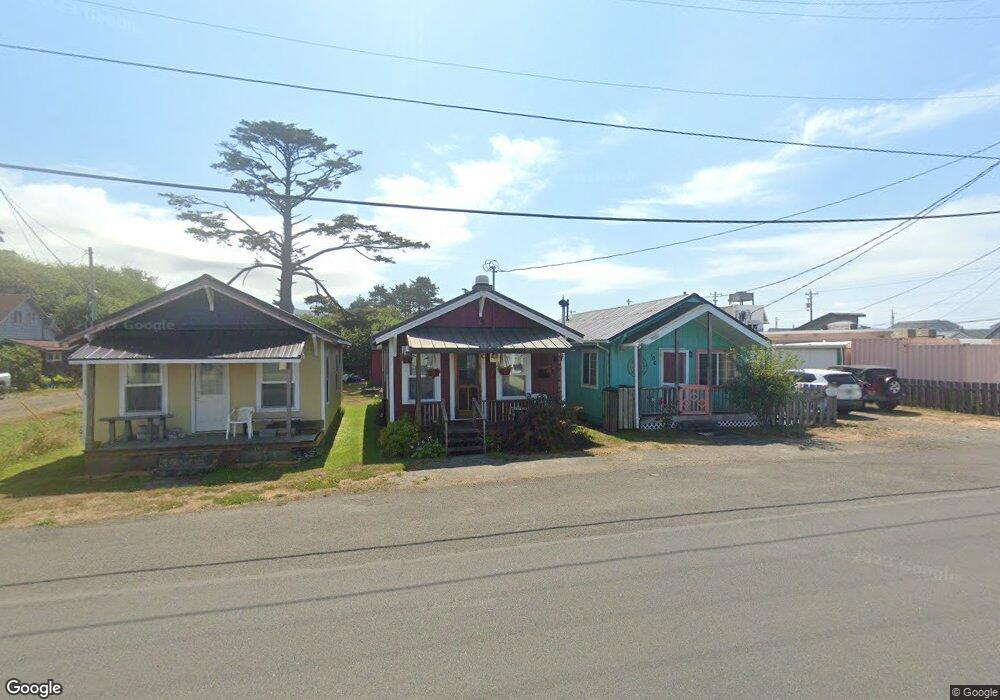
106 S 2nd Ave Rockaway Beach, OR 97136
Estimated Value: $401,000 - $547,000
2
Beds
4
Baths
1,299
Sq Ft
$369/Sq Ft
Est. Value
About This Home
This home is located at 106 S 2nd Ave, Rockaway Beach, OR 97136 and is currently estimated at $479,187, approximately $368 per square foot. 106 S 2nd Ave is a home located in Tillamook County with nearby schools including Garibaldi Elementary School, Nehalem Elementary School, and Neah-Kah-Nie Middle School.
Ownership History
Date
Name
Owned For
Owner Type
Purchase Details
Closed on
Mar 3, 2022
Sold by
Patricia Mortensen
Bought by
Simoes Anthony Leo
Current Estimated Value
Home Financials for this Owner
Home Financials are based on the most recent Mortgage that was taken out on this home.
Original Mortgage
$364,797
Outstanding Balance
$340,838
Interest Rate
3.92%
Mortgage Type
New Conventional
Estimated Equity
$138,349
Purchase Details
Closed on
Jun 23, 2015
Sold by
Federal Home Loan Mortgage Corporation
Bought by
Mortensen Patricia and Mortensen James
Purchase Details
Closed on
Jan 16, 2015
Sold by
Nold Gary G and Nold Mary J
Bought by
Federal Home Loan Mortgage Corporation
Purchase Details
Closed on
Jun 19, 2008
Sold by
Seascape Townhomes Llc
Bought by
Nold Gary G and Nold Mary J
Home Financials for this Owner
Home Financials are based on the most recent Mortgage that was taken out on this home.
Original Mortgage
$215,000
Interest Rate
5.75%
Mortgage Type
Purchase Money Mortgage
Create a Home Valuation Report for This Property
The Home Valuation Report is an in-depth analysis detailing your home's value as well as a comparison with similar homes in the area
Home Values in the Area
Average Home Value in this Area
Purchase History
| Date | Buyer | Sale Price | Title Company |
|---|---|---|---|
| Simoes Anthony Leo | $481,000 | Ticor Title | |
| Mortensen Patricia | $134,300 | Servicelink | |
| Federal Home Loan Mortgage Corporation | $146,073 | None Available | |
| Nold Gary G | $290,000 | First American |
Source: Public Records
Mortgage History
| Date | Status | Borrower | Loan Amount |
|---|---|---|---|
| Open | Simoes Anthony Leo | $364,797 | |
| Previous Owner | Nold Gary G | $215,000 |
Source: Public Records
Tax History Compared to Growth
Tax History
| Year | Tax Paid | Tax Assessment Tax Assessment Total Assessment is a certain percentage of the fair market value that is determined by local assessors to be the total taxable value of land and additions on the property. | Land | Improvement |
|---|---|---|---|---|
| 2024 | $2,465 | $254,900 | $81,360 | $173,540 |
| 2023 | $2,455 | $247,480 | $78,990 | $168,490 |
| 2022 | $2,378 | $240,280 | $76,680 | $163,600 |
| 2021 | $2,305 | $233,290 | $74,440 | $158,850 |
| 2020 | $2,240 | $226,500 | $72,270 | $154,230 |
| 2019 | $2,177 | $219,910 | $70,160 | $149,750 |
| 2018 | $2,122 | $213,510 | $68,110 | $145,400 |
| 2017 | $2,063 | $207,300 | $66,120 | $141,180 |
| 2016 | $1,500 | $150,340 | $42,770 | $107,570 |
| 2015 | $1,331 | $131,600 | $39,210 | $92,390 |
| 2014 | -- | $125,920 | $39,210 | $86,710 |
| 2013 | -- | $134,770 | $39,210 | $95,560 |
Source: Public Records
Map
Nearby Homes
- 185 S Coral St
- 407 S 2nd Ave
- 283 S Dolphin St
- 229 S Pacific St
- 259 S Pacific St
- 115 N Miller St Unit 103
- 115 N Miller St Unit 302
- 115 N Miller St Unit 402
- 115 N Miller St Unit 303
- 0 S 2nd Ave
- 0 22870 Unit 710378544
- 240 S Harbor St
- 333 Pacific View Dr
- Lot 57 Pacific View Dr Unit TL3700
- 367 S Longview Loop
- 168 N Pacific St
- 270 N Dolphin St
- 126 N Harbor St