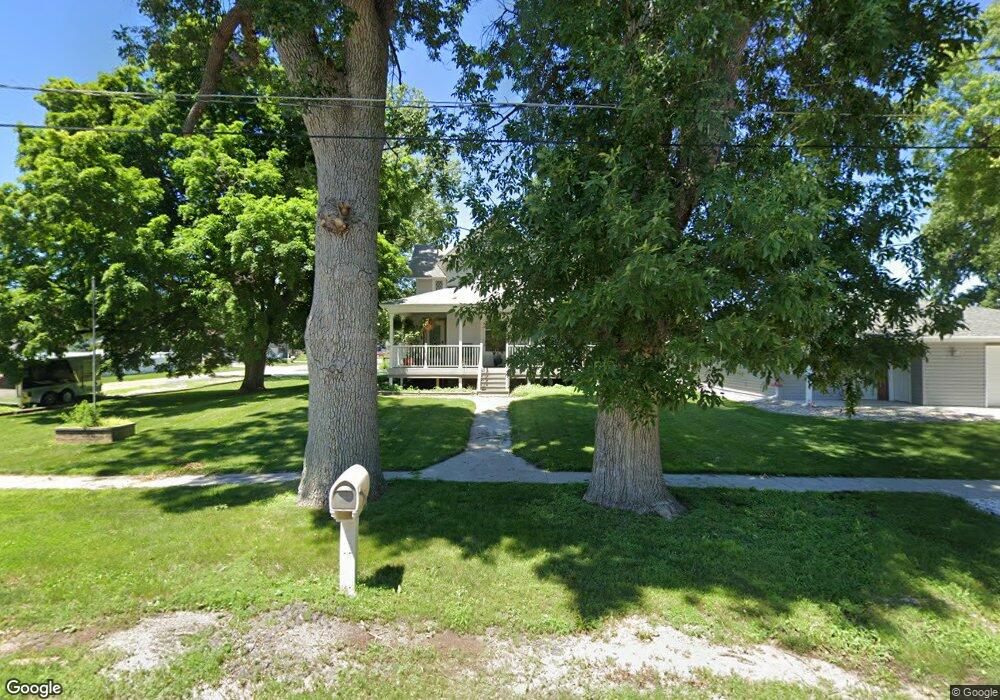
106 S 6th St Battle Creek, NE 68715
Estimated Value: $230,000 - $351,000
3
Beds
2
Baths
1,948
Sq Ft
$137/Sq Ft
Est. Value
About This Home
This home is located at 106 S 6th St, Battle Creek, NE 68715 and is currently estimated at $265,919, approximately $136 per square foot. 106 S 6th St is a home located in Madison County with nearby schools including Battle Creek Elementary School and Battle Creek High School.
Ownership History
Date
Name
Owned For
Owner Type
Purchase Details
Closed on
Oct 26, 2012
Sold by
The Secretary Of Hud Of Washington Dc
Bought by
Carter Tyler Jaimes and Carter Jessica Lea
Current Estimated Value
Home Financials for this Owner
Home Financials are based on the most recent Mortgage that was taken out on this home.
Original Mortgage
$20,000
Outstanding Balance
$14,766
Interest Rate
4.9%
Mortgage Type
New Conventional
Estimated Equity
$251,153
Purchase Details
Closed on
Apr 25, 2012
Sold by
Phh Mortgage Corporation
Bought by
Secretary Of Hud
Purchase Details
Closed on
Apr 19, 2012
Sold by
Meinke Jason A and Meinke Kristi L
Bought by
Phh Mortgage Corp
Purchase Details
Closed on
Feb 28, 2001
Sold by
Timm Matthew D and Timm Angela D
Bought by
Meinke Jason A and Meinke Kristi L
Purchase Details
Closed on
Aug 21, 2000
Sold by
Scranton Dix and Scranton Linda
Bought by
Timm Matthew D and Timm Angela D
Create a Home Valuation Report for This Property
The Home Valuation Report is an in-depth analysis detailing your home's value as well as a comparison with similar homes in the area
Home Values in the Area
Average Home Value in this Area
Purchase History
| Date | Buyer | Sale Price | Title Company |
|---|---|---|---|
| Carter Tyler Jaimes | -- | None Available | |
| Secretary Of Hud | -- | None Available | |
| Phh Mortgage Corp | $69,131 | None Available | |
| Meinke Jason A | $71,000 | -- | |
| Timm Matthew D | $66,106 | -- |
Source: Public Records
Mortgage History
| Date | Status | Borrower | Loan Amount |
|---|---|---|---|
| Open | Carter Tyler Jaimes | $20,000 |
Source: Public Records
Tax History Compared to Growth
Tax History
| Year | Tax Paid | Tax Assessment Tax Assessment Total Assessment is a certain percentage of the fair market value that is determined by local assessors to be the total taxable value of land and additions on the property. | Land | Improvement |
|---|---|---|---|---|
| 2024 | $2,313 | $183,196 | $5,251 | $177,945 |
| 2023 | $3,132 | $175,108 | $5,251 | $169,857 |
| 2022 | $2,292 | $128,155 | $5,251 | $122,904 |
| 2021 | $1,838 | $105,205 | $5,251 | $99,954 |
| 2020 | $1,682 | $96,952 | $5,251 | $91,701 |
| 2019 | $1,673 | $96,952 | $5,251 | $91,701 |
| 2018 | $1,468 | $89,267 | $4,936 | $84,331 |
| 2017 | $1,411 | $84,857 | $4,621 | $80,236 |
| 2016 | $1,495 | $86,582 | $4,621 | $81,961 |
| 2015 | $1,484 | $86,582 | $4,621 | $81,961 |
| 2014 | $1,428 | $78,637 | $4,201 | $74,436 |
| 2013 | $1,615 | $78,637 | $4,201 | $74,436 |
Source: Public Records
Map
Nearby Homes
- 202 Highland Dr
- 101 N 4th St
- 103 N 4th St
- 303 S Boyer St
- 304 E Herman St
- 401 E Hale St
- 000 836th 1 2 Rd
- 834th Rd 542nd Ave
- 5105 W Sherwood Rd
- 0 See Legal Unit 250827
- SEE Legal
- 84529 542 Ave
- 4801 N Deer Run Dr
- 856 S 4th St
- 854 4th St
- 84453 539th Ave
- 3900 Madison Ave
- 3507 Bradford Ave
- 3506 Bradford Ave
- 3407 Bradford Ave