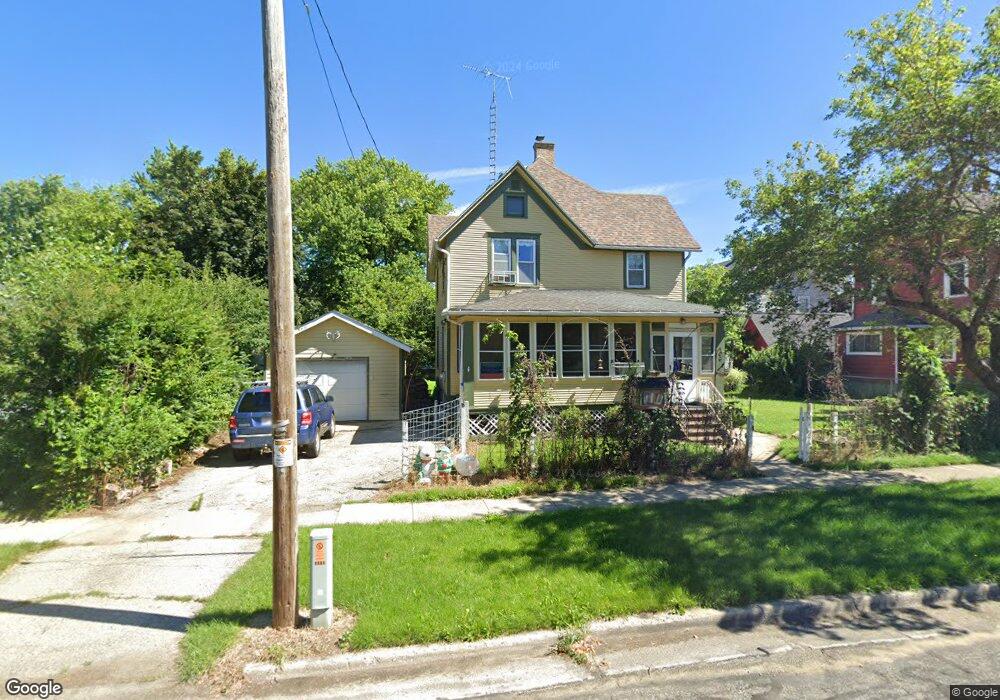
106 S 6th St Fort Atkinson, WI 53538
Estimated Value: $258,462 - $377,000
Studio
--
Bath
--
Sq Ft
5,227
Sq Ft Lot
About This Home
This home is located at 106 S 6th St, Fort Atkinson, WI 53538 and is currently estimated at $305,366. 106 S 6th St is a home located in Jefferson County with nearby schools including Luther Elementary School, Fort Atkinson Middle School, and Fort Atkinson High School.
Ownership History
Date
Name
Owned For
Owner Type
Purchase Details
Closed on
Jul 7, 2008
Sold by
Kircher Lesley A
Bought by
Gulig Anthony G
Current Estimated Value
Home Financials for this Owner
Home Financials are based on the most recent Mortgage that was taken out on this home.
Original Mortgage
$85,000
Interest Rate
6.1%
Mortgage Type
New Conventional
Create a Home Valuation Report for This Property
The Home Valuation Report is an in-depth analysis detailing your home's value as well as a comparison with similar homes in the area
Home Values in the Area
Average Home Value in this Area
Purchase History
| Date | Buyer | Sale Price | Title Company |
|---|---|---|---|
| Gulig Anthony G | -- | None Available |
Source: Public Records
Mortgage History
| Date | Status | Borrower | Loan Amount |
|---|---|---|---|
| Closed | Gulig Anthony G | $85,000 |
Source: Public Records
Tax History
| Year | Tax Paid | Tax Assessment Tax Assessment Total Assessment is a certain percentage of the fair market value that is determined by local assessors to be the total taxable value of land and additions on the property. | Land | Improvement |
|---|---|---|---|---|
| 2025 | $4,244 | $200,600 | $30,000 | $170,600 |
| 2024 | $3,736 | $200,600 | $30,000 | $170,600 |
| 2023 | $3,381 | $200,600 | $30,000 | $170,600 |
| 2022 | $3,634 | $141,400 | $20,500 | $120,900 |
| 2021 | $3,204 | $141,400 | $20,500 | $120,900 |
| 2020 | $3,150 | $141,400 | $20,500 | $120,900 |
| 2019 | $3,011 | $141,400 | $20,500 | $120,900 |
| 2018 | $2,906 | $141,400 | $20,500 | $120,900 |
| 2017 | $2,861 | $141,400 | $20,500 | $120,900 |
| 2016 | $2,858 | $136,300 | $17,200 | $119,100 |
| 2015 | $2,980 | $136,300 | $17,200 | $119,100 |
| 2014 | $2,878 | $136,300 | $17,200 | $119,100 |
| 2013 | $2,954 | $136,300 | $17,200 | $119,100 |
Source: Public Records
Map
Nearby Homes
- 11 S 4th St E
- 308 S 4th St W
- 234 S Main St
- 420 Jones Ave
- 910 S Main St
- 516 Riverside Dr
- 233 S Water St E
- 98 Jackson St
- 421 Milwaukee Ave E
- 108 Sherman Ave E
- 308 Adams St
- 821 Van Buren St
- 1000 Whitetail Dr
- 318 N 3rd St
- 321 Clarence St
- 602 Hilltop Trail W
- 333 Robert St
- 1227 S Main St
- 717 Harriette St
- 206 Hilltop Trail
Your Personal Tour Guide
Ask me questions while you tour the home.