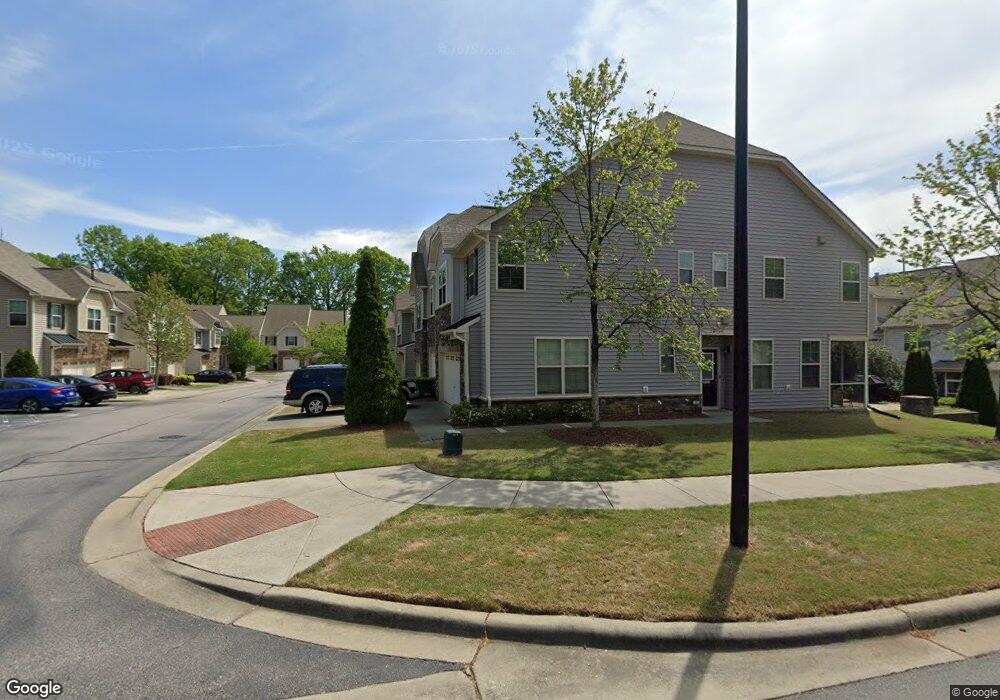
106 Salmon River Dr Unit 42 Durham, NC 27705
American Village NeighborhoodEstimated Value: $406,000 - $482,000
3
Beds
3
Baths
1,855
Sq Ft
$235/Sq Ft
Est. Value
About This Home
This home is located at 106 Salmon River Dr Unit 42, Durham, NC 27705 and is currently estimated at $435,541, approximately $234 per square foot. 106 Salmon River Dr Unit 42 is a home located in Durham County with nearby schools including Morehead Montessori, Brogden Middle, and Riverside High School.
Ownership History
Date
Name
Owned For
Owner Type
Purchase Details
Closed on
Mar 23, 2022
Sold by
Patel Shailesh N and Patel Mayuri S
Bought by
Patel Shailesh N and Patel Mayuri S
Current Estimated Value
Home Financials for this Owner
Home Financials are based on the most recent Mortgage that was taken out on this home.
Original Mortgage
$389,975
Outstanding Balance
$365,334
Interest Rate
4.16%
Mortgage Type
Balloon
Estimated Equity
$70,207
Purchase Details
Closed on
May 3, 2016
Sold by
Modarai Farhad
Bought by
Patel Shailesh N and Patel Mayuri S
Home Financials for this Owner
Home Financials are based on the most recent Mortgage that was taken out on this home.
Original Mortgage
$200,000
Interest Rate
3.58%
Purchase Details
Closed on
May 24, 2013
Sold by
Standard Pacific Of The Carolinas Llc
Bought by
Modarai Farhad
Home Financials for this Owner
Home Financials are based on the most recent Mortgage that was taken out on this home.
Original Mortgage
$206,370
Interest Rate
3.43%
Create a Home Valuation Report for This Property
The Home Valuation Report is an in-depth analysis detailing your home's value as well as a comparison with similar homes in the area
Home Values in the Area
Average Home Value in this Area
Purchase History
| Date | Buyer | Sale Price | Title Company |
|---|---|---|---|
| Patel Shailesh N | $410,500 | None Listed On Document | |
| Patel Shailesh N | $250,000 | -- | |
| Modarai Farhad | $207,000 | None Available |
Source: Public Records
Mortgage History
| Date | Status | Borrower | Loan Amount |
|---|---|---|---|
| Open | Patel Shailesh N | $389,975 | |
| Previous Owner | Patel Shailesh N | $200,000 | |
| Previous Owner | Modarai Farhad | $206,370 |
Source: Public Records
Tax History Compared to Growth
Tax History
| Year | Tax Paid | Tax Assessment Tax Assessment Total Assessment is a certain percentage of the fair market value that is determined by local assessors to be the total taxable value of land and additions on the property. | Land | Improvement |
|---|---|---|---|---|
| 2025 | $3,933 | $416,176 | $95,000 | $321,176 |
| 2024 | $3,933 | $281,921 | $50,000 | $231,921 |
| 2023 | $3,693 | $281,921 | $50,000 | $231,921 |
| 2022 | $3,608 | $281,921 | $50,000 | $231,921 |
| 2021 | $3,591 | $281,921 | $50,000 | $231,921 |
| 2020 | $3,507 | $281,921 | $50,000 | $231,921 |
| 2019 | $3,507 | $281,921 | $50,000 | $231,921 |
| 2018 | $3,141 | $231,578 | $40,000 | $191,578 |
| 2017 | $3,118 | $231,578 | $40,000 | $191,578 |
| 2016 | $3,013 | $231,578 | $40,000 | $191,578 |
| 2015 | $2,566 | $185,347 | $31,000 | $154,347 |
| 2014 | $2,566 | $185,347 | $31,000 | $154,347 |
Source: Public Records
Map
Nearby Homes
- 112 Salmon River Dr
- 108 Panamint Dr
- 220 Mount Evans Dr
- 15 Quintin Place
- 28 Prestwick Place
- 37 Georgetown Ct
- 210 Silas St
- 13 Providence Ct
- 123 Forest Oaks Dr
- 74 Forest Oaks Dr
- 82 Forest Oaks Dr
- 1229 Opal Ln Unit 84
- 4002 Westfield Dr
- 4219 Berini Dr
- 416 Morreene Rd
- 4229 American Dr Unit F
- 4316 American Dr
- 504 Soapstone Dr Unit 119
- 508 Soapstone Dr Unit 118
- 512 Soapstone Dr Unit 117
- 106 Salmon River Dr
- 108 Salmon River Dr
- 104 Salmon River Dr
- 110 Salmon River Dr Unit 40
- 102 Salmon River Dr
- 100 Salmon River Dr Unit 45
- 100 Salmon River Dr
- 112 Salmon River Dr Unit 39
- 19 Sangre de Cristo Dr Unit 36
- 17 Sangre de Cristo Dr Unit 35
- 17 Sangre de Cristo Dr
- 15 Sangre de Cristo Dr
- 13 Sangre de Cristo Dr Unit 33
- 13 Sangre de Cristo Dr
- 21 Sangre de Cristo Dr Unit 1
- 21 Sangre de Cristo Dr
- 21 Sangre de Cristo Dr Unit 37
- 107 Salmon River Dr Unit 2
- 107 Salmon River Dr
- 105 Salmon River Dr Unit 1