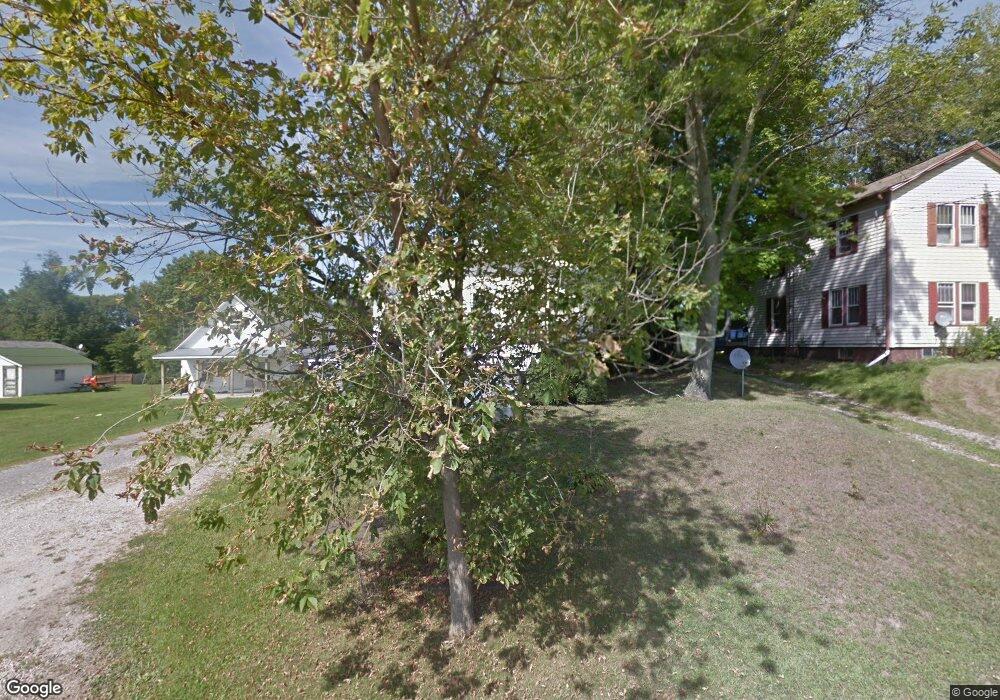
106 Scranton Ave Unit 2A Minerva, OH 44657
Estimated Value: $71,852 - $118,000
3
Beds
1
Bath
840
Sq Ft
$122/Sq Ft
Est. Value
About This Home
This home is located at 106 Scranton Ave Unit 2A, Minerva, OH 44657 and is currently estimated at $102,713, approximately $122 per square foot. 106 Scranton Ave Unit 2A is a home located in Carroll County with nearby schools including Minerva Elementary School, Minerva Middle School, and Minerva High School.
Create a Home Valuation Report for This Property
The Home Valuation Report is an in-depth analysis detailing your home's value as well as a comparison with similar homes in the area
Home Values in the Area
Average Home Value in this Area
Tax History
| Year | Tax Paid | Tax Assessment Tax Assessment Total Assessment is a certain percentage of the fair market value that is determined by local assessors to be the total taxable value of land and additions on the property. | Land | Improvement |
|---|---|---|---|---|
| 2024 | $622 | $15,220 | $3,510 | $11,710 |
| 2023 | $648 | $15,220 | $3,510 | $11,710 |
| 2022 | $651 | $12,610 | $2,920 | $9,690 |
| 2021 | $559 | $12,610 | $2,920 | $9,690 |
| 2020 | $586 | $12,610 | $2,920 | $9,690 |
| 2019 | $514 | $12,615 | $2,923 | $9,692 |
| 2018 | $512 | $11,670 | $3,190 | $8,480 |
| 2017 | $526 | $11,670 | $3,190 | $8,480 |
| 2016 | $496 | $10,700 | $2,920 | $7,780 |
| 2015 | $496 | $10,700 | $2,920 | $7,780 |
| 2014 | $510 | $10,700 | $2,920 | $7,780 |
| 2013 | $510 | $10,700 | $2,920 | $7,780 |
Source: Public Records
Map
Nearby Homes
- 513 Queen St Unit 1A
- 113 W 1st St
- 701 E Lincolnway
- 0 Lynnwood Dr
- 720 Mcdaniel Ave
- 208 Ridgewood Blvd
- 0 Surrey Dr SE
- 22141 Mcdaniel St
- 8087 Magnet Rd NE Unit 13E
- 0 Leopard Rd NW Unit 3
- 0 Leopard Rd NW Unit 5
- 0 Leopard Rd NW
- 0 Leopard Rd NW Unit 6
- 0 Leopard Rd NW Unit 4
- 14000 Lincoln St SE Unit LOT A
- 14000 Lincoln St SE Unit 3
- 14000 Lincoln St SE Unit 16
- 10294 Manor Rd NE
- 23894 Sandy Creek Rd
- 11153 Augusta Rd
- 104 Scranton Ave Unit 2A
- 102 Scranton Ave Unit 2A
- 108 Scranton Ave Unit 2A
- 100 Scranton Ave Unit 2A
- 100 1/2 Scranton Ave Unit 2A
- 111 Scranton Ave Unit 2A
- 109 Scranton Ave
- 806 S Grant Blvd Unit 2A
- 806 S Grant Blvd Unit 2A
- 806 S Grant Blvd
- 816 S Grant Blvd Unit 2A
- 119 Scranton Ave Unit 16
- 101 Scranton Ave Unit 16
- 115 Scranton Ave Unit 2A
- 824 S Grant Blvd Unit 27
- 808 S Grant Blvd Unit 2A
- 802 S Grant Blvd Unit 2A
- 828 S Grant Blvd Unit 27
- 117 Scranton Ave Unit 16
- 161 Scranton Ave Unit 2A
Your Personal Tour Guide
Ask me questions while you tour the home.