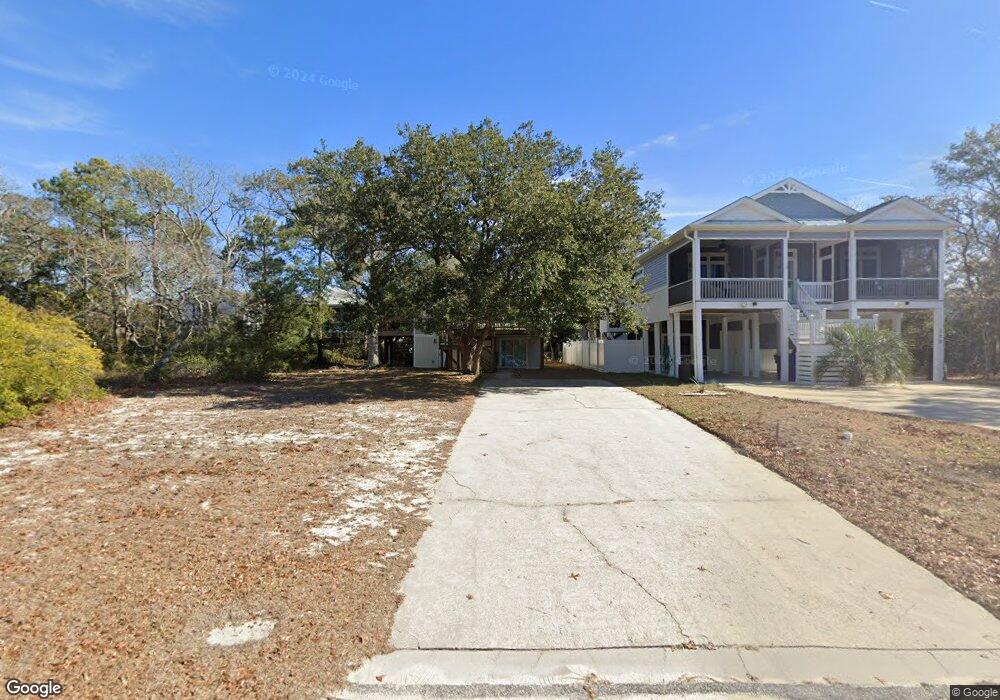
106 SE 2nd St Oak Island, NC 28465
Estimated Value: $397,000 - $691,376
2
Beds
2
Baths
1,728
Sq Ft
$296/Sq Ft
Est. Value
About This Home
This home is located at 106 SE 2nd St, Oak Island, NC 28465 and is currently estimated at $511,594, approximately $296 per square foot. 106 SE 2nd St is a home located in Brunswick County with nearby schools including Southport Elementary School, South Brunswick Middle School, and South Brunswick High School.
Ownership History
Date
Name
Owned For
Owner Type
Purchase Details
Closed on
Feb 27, 2008
Sold by
Pilla Dale A
Bought by
Paranova Properties Llc
Current Estimated Value
Purchase Details
Closed on
Jun 29, 2007
Sold by
Vaughn Joseph J and Harwell Jean B
Bought by
Pilla Dale A
Home Financials for this Owner
Home Financials are based on the most recent Mortgage that was taken out on this home.
Original Mortgage
$103,200
Interest Rate
6.37%
Mortgage Type
Adjustable Rate Mortgage/ARM
Purchase Details
Closed on
Jun 21, 2007
Sold by
Foster Roderick N and Hain Frederick J
Bought by
Vaughn Joseph J and Harwell Jean B
Home Financials for this Owner
Home Financials are based on the most recent Mortgage that was taken out on this home.
Original Mortgage
$103,200
Interest Rate
6.37%
Mortgage Type
Adjustable Rate Mortgage/ARM
Purchase Details
Closed on
Apr 16, 2007
Sold by
Foster Roderick N and Hain Frederick J
Bought by
Vaughn Joseph J and Harwell Jean B
Create a Home Valuation Report for This Property
The Home Valuation Report is an in-depth analysis detailing your home's value as well as a comparison with similar homes in the area
Home Values in the Area
Average Home Value in this Area
Purchase History
| Date | Buyer | Sale Price | Title Company |
|---|---|---|---|
| Paranova Properties Llc | $142,500 | None Available | |
| Pilla Dale A | $129,000 | None Available | |
| Vaughn Joseph J | -- | None Available | |
| Vaughn Joseph J | $10,900 | None Available |
Source: Public Records
Mortgage History
| Date | Status | Borrower | Loan Amount |
|---|---|---|---|
| Previous Owner | Pilla Dale A | $103,200 |
Source: Public Records
Tax History Compared to Growth
Tax History
| Year | Tax Paid | Tax Assessment Tax Assessment Total Assessment is a certain percentage of the fair market value that is determined by local assessors to be the total taxable value of land and additions on the property. | Land | Improvement |
|---|---|---|---|---|
| 2025 | $1,610 | $369,000 | $145,000 | $224,000 |
| 2024 | $1,610 | $369,000 | $145,000 | $224,000 |
| 2023 | $1,190 | $369,000 | $145,000 | $224,000 |
| 2022 | $1,190 | $192,470 | $69,000 | $123,470 |
| 2021 | $1,160 | $192,470 | $69,000 | $123,470 |
| 2020 | $1,135 | $192,470 | $69,000 | $123,470 |
| 2019 | $1,135 | $69,940 | $69,000 | $940 |
| 2018 | $925 | $37,940 | $37,000 | $940 |
| 2017 | $925 | $37,940 | $37,000 | $940 |
| 2016 | $900 | $37,940 | $37,000 | $940 |
| 2015 | $900 | $152,430 | $37,000 | $115,430 |
| 2014 | $951 | $176,385 | $45,000 | $131,385 |
Source: Public Records
Map
Nearby Homes
- 120 SE 2nd St
- 122 SE 2nd St
- 108 SE 3rd St
- 117 SE 4th St
- 6 White Ln
- 403 E Oak Island Dr
- 105 NE 3rd St
- 109 NE 1st St
- 101 NE 5th St
- 101 W Oak Island Dr
- 102 NW 1st St
- 103 NE 5th St
- 312 E Dolphin Dr
- 316 E Dolphin Dr
- 108 W Dolphin Dr
- 106 NW 2nd
- 308 E Beach Dr
- 126 N Middleton Ave
- 124 W Pelican Dr
- 110 SE 7th St