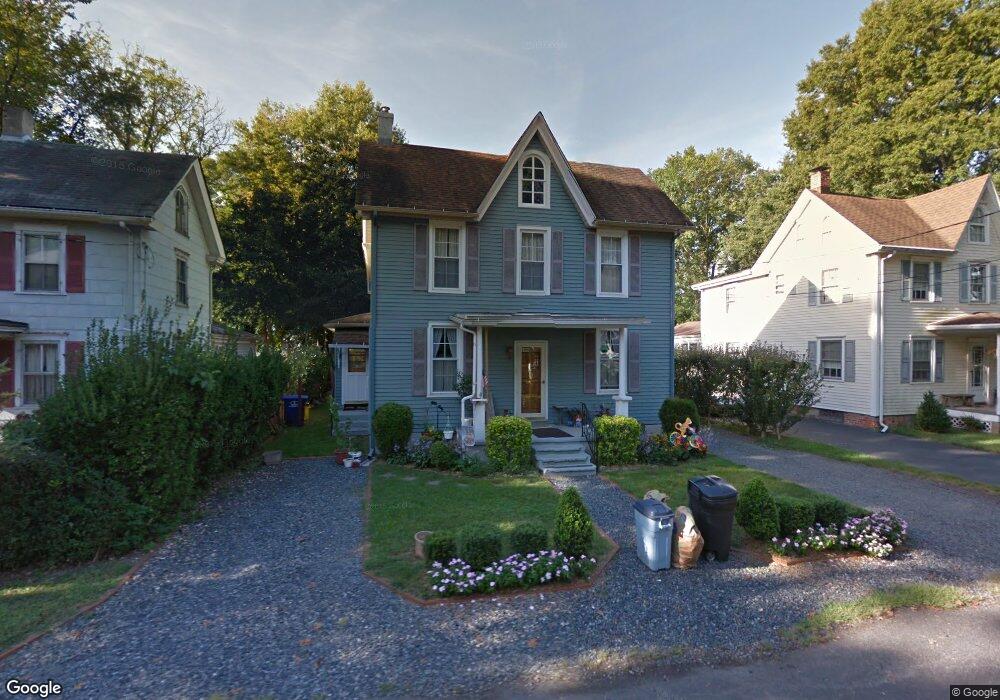
106 Second St Rancocas, NJ 08073
Estimated Value: $294,844 - $346,000
Studio
--
Bath
1,506
Sq Ft
$214/Sq Ft
Est. Value
About This Home
This home is located at 106 Second St, Rancocas, NJ 08073 and is currently estimated at $322,461, approximately $214 per square foot. 106 Second St is a home with nearby schools including Holly Hills Elementary School, Westampton Intermediate School, and Rancocas Valley Regional High School.
Ownership History
Date
Name
Owned For
Owner Type
Purchase Details
Closed on
Oct 29, 2003
Sold by
Culligan Joseph W and Culligan Suzanne M
Bought by
Milligan Michael and Milligan Joy L
Current Estimated Value
Home Financials for this Owner
Home Financials are based on the most recent Mortgage that was taken out on this home.
Original Mortgage
$159,125
Outstanding Balance
$72,795
Interest Rate
5.81%
Mortgage Type
Stand Alone First
Estimated Equity
$249,666
Purchase Details
Closed on
Aug 21, 1995
Sold by
Bell William L and Bell Dorothy M
Bought by
Culligan Joseph W and Culligan Suzanne M
Create a Home Valuation Report for This Property
The Home Valuation Report is an in-depth analysis detailing your home's value as well as a comparison with similar homes in the area
Home Values in the Area
Average Home Value in this Area
Purchase History
| Date | Buyer | Sale Price | Title Company |
|---|---|---|---|
| Milligan Michael | $167,500 | Commonwealth Land Title | |
| Culligan Joseph W | $70,000 | Commonwealth Land Title Ins |
Source: Public Records
Mortgage History
| Date | Status | Borrower | Loan Amount |
|---|---|---|---|
| Open | Milligan Michael | $159,125 |
Source: Public Records
Tax History
| Year | Tax Paid | Tax Assessment Tax Assessment Total Assessment is a certain percentage of the fair market value that is determined by local assessors to be the total taxable value of land and additions on the property. | Land | Improvement |
|---|---|---|---|---|
| 2025 | $5,396 | $192,100 | $65,000 | $127,100 |
| 2024 | $5,192 | $192,100 | $65,000 | $127,100 |
| 2023 | $5,192 | $192,100 | $65,000 | $127,100 |
| 2022 | $4,933 | $192,100 | $65,000 | $127,100 |
| 2021 | $4,751 | $192,100 | $65,000 | $127,100 |
| 2020 | $4,731 | $192,100 | $65,000 | $127,100 |
| 2019 | $4,635 | $192,100 | $65,000 | $127,100 |
| 2018 | $4,576 | $192,100 | $65,000 | $127,100 |
| 2017 | $4,455 | $192,100 | $65,000 | $127,100 |
| 2016 | $4,372 | $192,100 | $65,000 | $127,100 |
| 2015 | $4,288 | $192,100 | $65,000 | $127,100 |
| 2014 | $4,178 | $192,100 | $65,000 | $127,100 |
Source: Public Records
Map
Nearby Homes
Your Personal Tour Guide
Ask me questions while you tour the home.