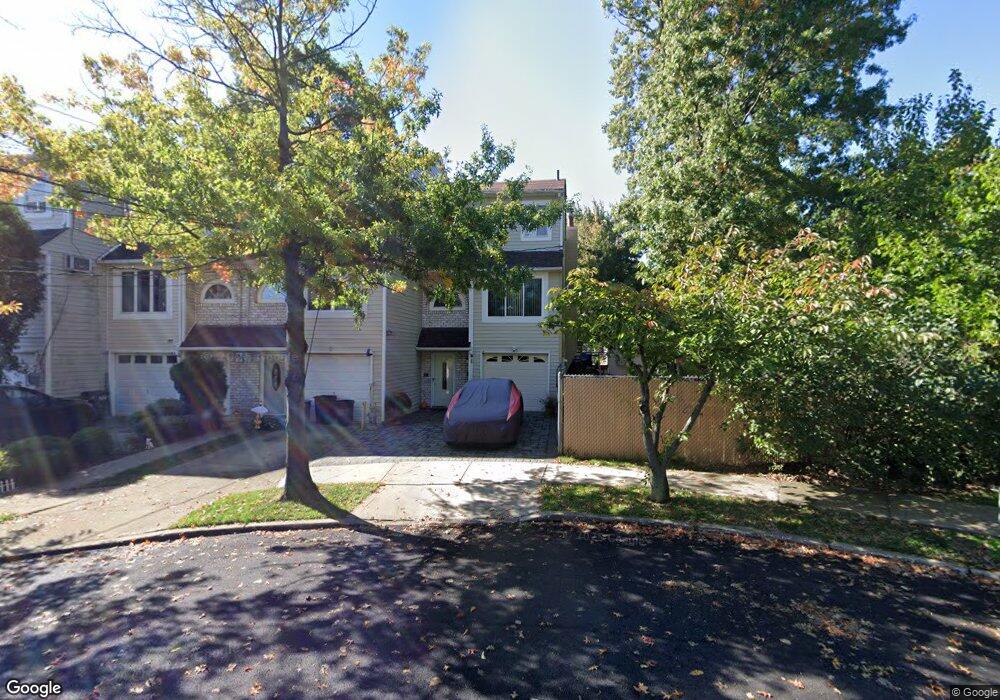
106 Seguine Place Staten Island, NY 10312
Annadale NeighborhoodEstimated Value: $726,000 - $801,000
4
Beds
2
Baths
1,750
Sq Ft
$445/Sq Ft
Est. Value
About This Home
This home is located at 106 Seguine Place, Staten Island, NY 10312 and is currently estimated at $779,369, approximately $445 per square foot. 106 Seguine Place is a home located in Richmond County with nearby schools including P.S. 55 The Henry M. Boehm School, I.S. 007 Elias Bernstein, and Tottenville High School.
Ownership History
Date
Name
Owned For
Owner Type
Purchase Details
Closed on
Dec 8, 2011
Sold by
Vachakigze Vitali and Filatova Oksana
Bought by
Vachakidze Vitali and Filatova Oksana
Current Estimated Value
Home Financials for this Owner
Home Financials are based on the most recent Mortgage that was taken out on this home.
Original Mortgage
$6,028
Outstanding Balance
$651
Interest Rate
4%
Mortgage Type
New Conventional
Estimated Equity
$778,718
Purchase Details
Closed on
May 9, 2001
Sold by
Devitto Maria R
Bought by
Vachakigze Vitali and Filatova Oksano
Home Financials for this Owner
Home Financials are based on the most recent Mortgage that was taken out on this home.
Original Mortgage
$193,600
Outstanding Balance
$72,932
Interest Rate
7.15%
Mortgage Type
Purchase Money Mortgage
Estimated Equity
$706,437
Purchase Details
Closed on
Apr 18, 1996
Sold by
Devitto Perry J and Devitto Maria R
Bought by
Corradi Maria Devitto
Create a Home Valuation Report for This Property
The Home Valuation Report is an in-depth analysis detailing your home's value as well as a comparison with similar homes in the area
Home Values in the Area
Average Home Value in this Area
Purchase History
| Date | Buyer | Sale Price | Title Company |
|---|---|---|---|
| Vachakidze Vitali | -- | Old Republic National Title | |
| Vachakigze Vitali | $242,000 | -- | |
| Corradi Maria Devitto | $50,000 | Chicago Title Insurance Co |
Source: Public Records
Mortgage History
| Date | Status | Borrower | Loan Amount |
|---|---|---|---|
| Open | Vachakidze Vitali | $6,028 | |
| Open | Vachakigze Vitali | $193,600 |
Source: Public Records
Tax History Compared to Growth
Tax History
| Year | Tax Paid | Tax Assessment Tax Assessment Total Assessment is a certain percentage of the fair market value that is determined by local assessors to be the total taxable value of land and additions on the property. | Land | Improvement |
|---|---|---|---|---|
| 2025 | $6,938 | $49,140 | $10,104 | $39,036 |
| 2024 | $6,938 | $40,140 | $11,669 | $28,471 |
| 2023 | $6,618 | $32,588 | $10,491 | $22,097 |
| 2022 | $6,137 | $36,480 | $13,560 | $22,920 |
| 2021 | $6,470 | $34,440 | $13,560 | $20,880 |
| 2020 | $6,459 | $33,660 | $13,560 | $20,100 |
| 2019 | $6,022 | $30,660 | $13,560 | $17,100 |
| 2018 | $5,536 | $27,157 | $12,153 | $15,004 |
| 2017 | $5,223 | $25,620 | $13,560 | $12,060 |
| 2016 | $5,422 | $27,120 | $13,560 | $13,560 |
| 2015 | $4,775 | $26,374 | $10,826 | $15,548 |
| 2014 | $4,775 | $24,883 | $10,395 | $14,488 |
Source: Public Records
Map
Nearby Homes
- 104 Sneden Ave
- 71 Eagan Ave
- 0 Eagan Ave
- 204 Sneden Ave
- 42 Mosely Ave
- 33 Lorrain Ave
- 230 Barclay Ave
- 15 Bovanizer St
- 47 Village Ln Unit B
- 6 Mosely Ave
- 449 Pompey Ave
- 4664 Amboy Rd
- 46 Hillis St
- 39 Adlai Cir
- 2 Radnor St
- 717 Annadale Rd
- 714 Annadale Rd
- 46 Rochelle Place
- 58 Sylvia St
- 82 Woods of Arden Rd