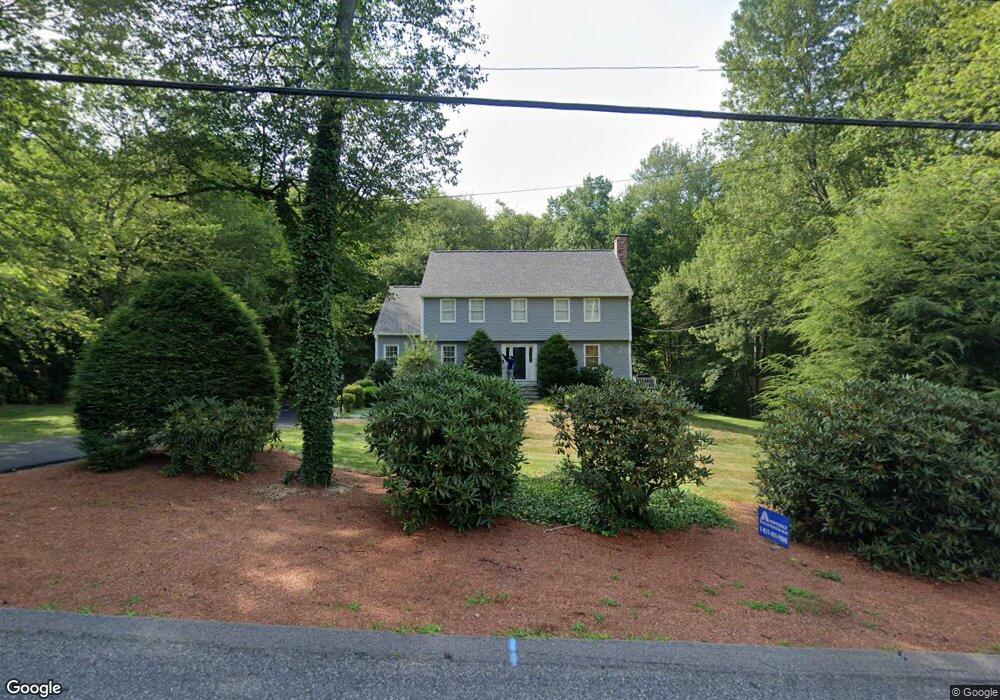
106 Spring St Hopkinton, MA 01748
Estimated Value: $926,582 - $1,108,000
4
Beds
3
Baths
2,899
Sq Ft
$354/Sq Ft
Est. Value
About This Home
This home is located at 106 Spring St, Hopkinton, MA 01748 and is currently estimated at $1,026,896, approximately $354 per square foot. 106 Spring St is a home located in Middlesex County with nearby schools including Elmwood Elementary School, Hopkins Elementary School, and Hopkinton Middle School.
Ownership History
Date
Name
Owned For
Owner Type
Purchase Details
Closed on
Sep 7, 2001
Sold by
Trudeau Philip L and Trudeau Christinna
Bought by
Kalmbach Bernard and Sanborn Jennifer
Current Estimated Value
Home Financials for this Owner
Home Financials are based on the most recent Mortgage that was taken out on this home.
Original Mortgage
$250,000
Outstanding Balance
$97,912
Interest Rate
7.05%
Mortgage Type
Purchase Money Mortgage
Estimated Equity
$928,984
Purchase Details
Closed on
May 24, 1993
Sold by
Hurley Dennis M and Hurley Marlene E
Bought by
Trudeau Philip L and Trudeau Christianna M
Home Financials for this Owner
Home Financials are based on the most recent Mortgage that was taken out on this home.
Original Mortgage
$184,000
Interest Rate
7.54%
Mortgage Type
Purchase Money Mortgage
Create a Home Valuation Report for This Property
The Home Valuation Report is an in-depth analysis detailing your home's value as well as a comparison with similar homes in the area
Home Values in the Area
Average Home Value in this Area
Purchase History
| Date | Buyer | Sale Price | Title Company |
|---|---|---|---|
| Kalmbach Bernard | $482,500 | -- | |
| Trudeau Philip L | $230,000 | -- |
Source: Public Records
Mortgage History
| Date | Status | Borrower | Loan Amount |
|---|---|---|---|
| Open | Kalmbach Bernard | $250,000 | |
| Previous Owner | Trudeau Philip L | $175,000 | |
| Previous Owner | Trudeau Philip L | $184,000 | |
| Previous Owner | Trudeau Philip L | $165,000 |
Source: Public Records
Tax History Compared to Growth
Tax History
| Year | Tax Paid | Tax Assessment Tax Assessment Total Assessment is a certain percentage of the fair market value that is determined by local assessors to be the total taxable value of land and additions on the property. | Land | Improvement |
|---|---|---|---|---|
| 2025 | $10,642 | $750,500 | $303,300 | $447,200 |
| 2024 | $10,497 | $718,500 | $288,600 | $429,900 |
| 2023 | $10,319 | $652,700 | $253,400 | $399,300 |
| 2022 | $10,131 | $594,900 | $230,100 | $364,800 |
| 2021 | $9,850 | $576,700 | $223,300 | $353,400 |
| 2020 | $9,434 | $560,900 | $218,100 | $342,800 |
| 2019 | $9,014 | $525,000 | $213,800 | $311,200 |
| 2018 | $8,558 | $506,400 | $203,500 | $302,900 |
| 2017 | $7,997 | $476,000 | $197,400 | $278,600 |
| 2016 | $7,904 | $464,100 | $193,600 | $270,500 |
| 2015 | $7,933 | $441,700 | $188,000 | $253,700 |
Source: Public Records
Map
Nearby Homes