Estimated Value: $421,311 - $470,000
4
Beds
3
Baths
2,778
Sq Ft
$160/Sq Ft
Est. Value
About This Home
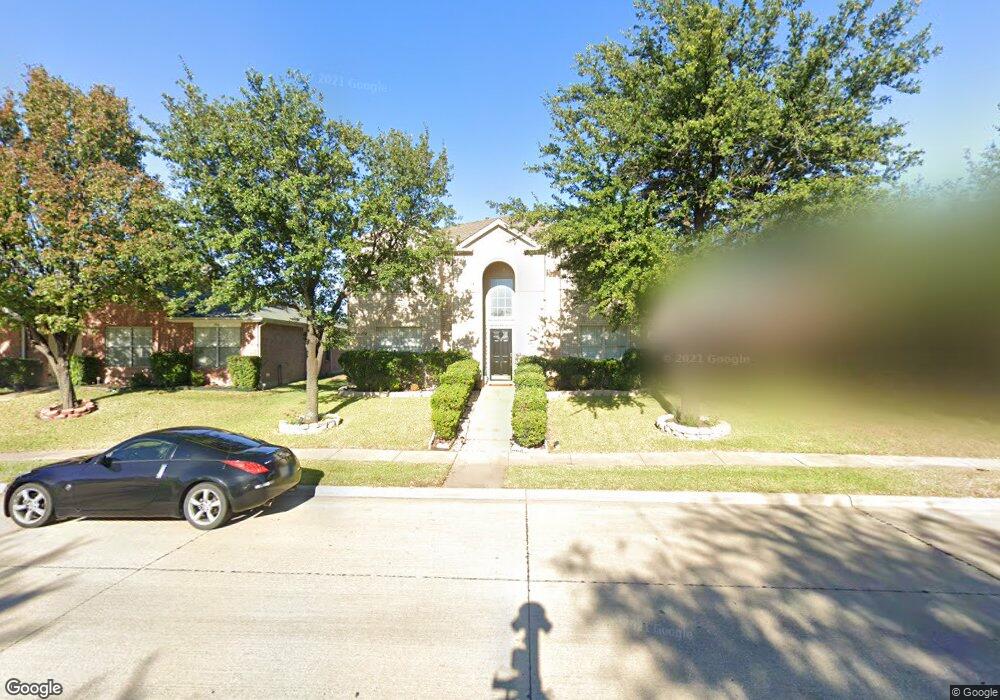
This home is located at 106 Springwell Pkwy, Wylie, TX 75098 and is currently estimated at $445,578, approximately $160 per square foot. 106 Springwell Pkwy is a home located in Collin County with nearby schools including R V Groves Elementary School, Dr. Al Draper Intermediate Middle School, and Raymond B Cooper J High School.
Ownership History
Date
Name
Owned For
Owner Type
Purchase Details
Closed on
May 17, 2005
Sold by
Hud
Bought by
Tsegay Tekeste and Tsegay Abel
Current Estimated Value
Home Financials for this Owner
Home Financials are based on the most recent Mortgage that was taken out on this home.
Original Mortgage
$114,450
Outstanding Balance
$59,981
Interest Rate
5.92%
Mortgage Type
Fannie Mae Freddie Mac
Estimated Equity
$385,597
Purchase Details
Closed on
Feb 7, 2005
Sold by
National City Mortgage Co
Bought by
Hud
Purchase Details
Closed on
Dec 7, 2004
Sold by
Diego Miguel and Diego Vera S
Bought by
National City Mortgage Co
Purchase Details
Closed on
Aug 31, 2000
Sold by
Pulte Homes Of Texas Lp
Bought by
Diego Miguel and Diego Vera S
Home Financials for this Owner
Home Financials are based on the most recent Mortgage that was taken out on this home.
Original Mortgage
$156,442
Interest Rate
8.15%
Mortgage Type
FHA
Create a Home Valuation Report for This Property
The Home Valuation Report is an in-depth analysis detailing your home's value as well as a comparison with similar homes in the area
Home Values in the Area
Average Home Value in this Area
Purchase History
| Date | Buyer | Sale Price | Title Company |
|---|---|---|---|
| Tsegay Tekeste | -- | -- | |
| Hud | -- | -- | |
| National City Mortgage Co | $158,152 | -- | |
| Diego Miguel | -- | First American Title Co |
Source: Public Records
Mortgage History
| Date | Status | Borrower | Loan Amount |
|---|---|---|---|
| Open | Tsegay Tekeste | $114,450 | |
| Previous Owner | Diego Miguel | $156,442 | |
| Closed | Tsegay Tekeste | $14,300 |
Source: Public Records
Tax History Compared to Growth
Tax History
| Year | Tax Paid | Tax Assessment Tax Assessment Total Assessment is a certain percentage of the fair market value that is determined by local assessors to be the total taxable value of land and additions on the property. | Land | Improvement |
|---|---|---|---|---|
| 2025 | $1,478 | $460,940 | $95,000 | $369,872 |
| 2024 | $1,478 | $419,036 | $95,000 | $324,036 |
| 2023 | $1,478 | $389,272 | $95,000 | $300,157 |
| 2022 | $7,764 | $353,884 | $75,000 | $296,139 |
| 2021 | $7,569 | $322,276 | $55,000 | $267,276 |
| 2020 | $7,262 | $292,466 | $55,000 | $237,466 |
| 2019 | $7,186 | $273,458 | $55,000 | $247,680 |
| 2018 | $6,695 | $248,598 | $55,000 | $229,364 |
| 2017 | $6,086 | $256,092 | $50,000 | $206,092 |
| 2016 | $5,709 | $216,868 | $40,000 | $176,868 |
| 2015 | $3,563 | $195,890 | $35,000 | $160,890 |
Source: Public Records
Map
Nearby Homes
- 3006 Springwell Pkwy
- 3103 Creekwood Dr
- 3017 Eagle Mountain Dr
- Iris Plan at Wooded Creek
- Beckett II Plan at Wooded Creek
- Annabelle III Plan at Wooded Creek
- 206 Grassy Creek Dr
- 3003 Candlebrook Dr
- 3111 Candlebrook Dr
- 208 Lakefront Dr
- 310 Admiral Dr
- 3105 Admiral Dr
- 2606 Parkbridge Ct
- 307 Wooded Creek Ave
- 2615 Gum Tree Trail
- 207 Creekview Dr
- 301 Creekview Dr
- 2722 W Fm 544
- 3014 Eastwood Dr
- 3600 Nandina Dr
- 104 Springwell Pkwy
- 108 Springwell Pkwy
- 102 Springwell Pkwy
- 110 Springwell Pkwy
- 101 Cobblestone Dr
- 103 Cobblestone Dr
- 200 Springwell Pkwy
- 100 Springwell Pkwy
- 2905 Lakefield Dr
- 105 Cobblestone Dr
- 2903 Lakefield Dr
- 107 Cobblestone Dr
- 202 Springwell Pkwy
- 2901 Lakefield Dr
- 109 Cobblestone Dr
- 204 Springwell Pkwy
- 111 Cobblestone Dr
- 3000 Springwell Pkwy
- 100 Cobblestone Dr
- 102 Cobblestone Dr