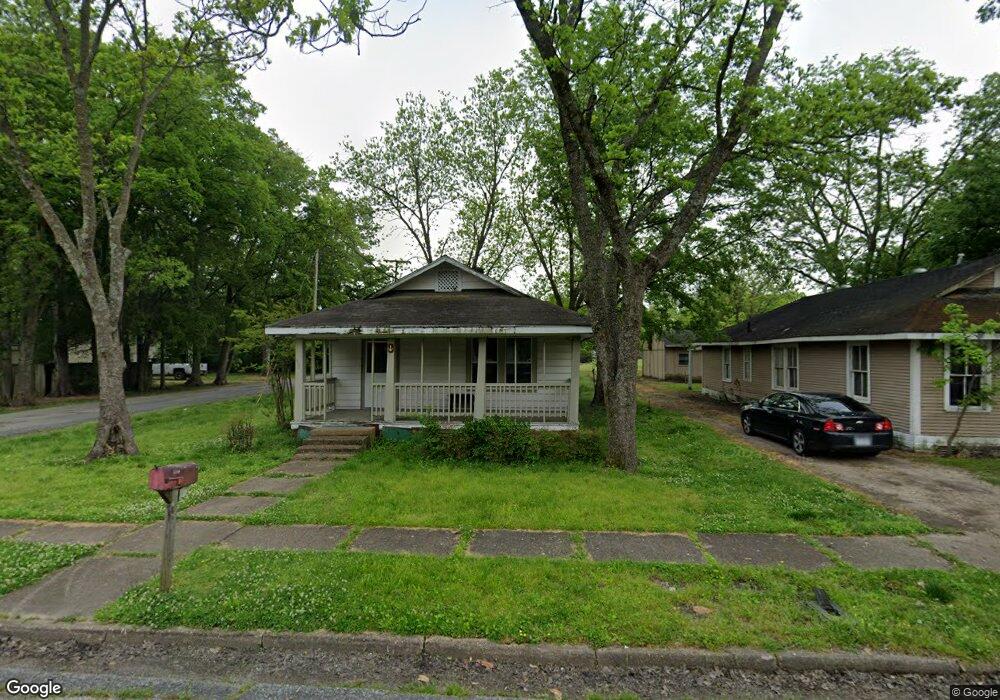
106 Sycamore St Marked Tree, AR 72365
Estimated Value: $76,238 - $103,000
Studio
1
Bath
1,032
Sq Ft
$84/Sq Ft
Est. Value
About This Home
This home is located at 106 Sycamore St, Marked Tree, AR 72365 and is currently estimated at $86,310, approximately $83 per square foot. 106 Sycamore St is a home located in Poinsett County with nearby schools including Marked Tree Elementary School and Marked Tree High School.
Ownership History
Date
Name
Owned For
Owner Type
Purchase Details
Closed on
May 8, 2023
Sold by
Hood David W and Hood David Wayne
Bought by
Brandon Gillis Real Estate Llc
Current Estimated Value
Home Financials for this Owner
Home Financials are based on the most recent Mortgage that was taken out on this home.
Original Mortgage
$59,500
Outstanding Balance
$29,140
Interest Rate
6.42%
Mortgage Type
Credit Line Revolving
Estimated Equity
$57,170
Purchase Details
Closed on
May 4, 2023
Sold by
G & S Land Company Llc
Bought by
Poinsett Co Re Llc
Home Financials for this Owner
Home Financials are based on the most recent Mortgage that was taken out on this home.
Original Mortgage
$59,500
Outstanding Balance
$29,140
Interest Rate
6.42%
Mortgage Type
Credit Line Revolving
Estimated Equity
$57,170
Purchase Details
Closed on
Jul 20, 1999
Sold by
Not Provided
Bought by
Hood David W and Hood Rhonda R
Create a Home Valuation Report for This Property
The Home Valuation Report is an in-depth analysis detailing your home's value as well as a comparison with similar homes in the area
Purchase History
| Date | Buyer | Sale Price | Title Company |
|---|---|---|---|
| Brandon Gillis Real Estate Llc | $70,000 | Professional Title | |
| Poinsett Co Re Llc | $500,000 | Professional Land Title | |
| Hood David W | $23,500 | -- |
Source: Public Records
Mortgage History
| Date | Status | Borrower | Loan Amount |
|---|---|---|---|
| Open | Brandon Gillis Real Estate Llc | $59,500 |
Source: Public Records
Tax History
| Year | Tax Paid | Tax Assessment Tax Assessment Total Assessment is a certain percentage of the fair market value that is determined by local assessors to be the total taxable value of land and additions on the property. | Land | Improvement |
|---|---|---|---|---|
| 2025 | $377 | $7,730 | $930 | $6,800 |
| 2024 | $377 | $7,730 | $930 | $6,800 |
| 2023 | $287 | $7,730 | $930 | $6,800 |
| 2022 | $263 | $7,730 | $930 | $6,800 |
| 2021 | $240 | $4,480 | $930 | $3,550 |
| 2020 | $240 | $4,480 | $930 | $3,550 |
| 2019 | $240 | $4,480 | $930 | $3,550 |
| 2018 | $240 | $4,480 | $930 | $3,550 |
| 2017 | $186 | $4,480 | $930 | $3,550 |
| 2016 | $196 | $4,700 | $300 | $4,400 |
| 2015 | $196 | $4,700 | $300 | $4,400 |
| 2014 | $196 | $4,700 | $300 | $4,400 |
Source: Public Records
Map
Nearby Homes
Your Personal Tour Guide
Ask me questions while you tour the home.