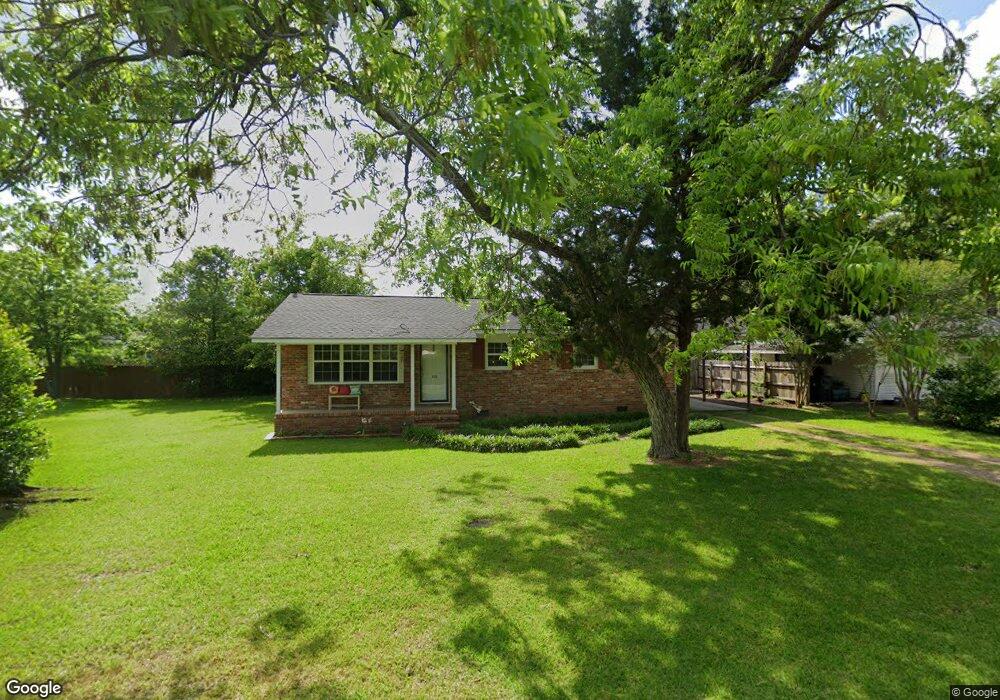
106 Terry Ave Fitzgerald, GA 31750
Estimated Value: $77,911 - $130,000
3
Beds
1
Bath
1,188
Sq Ft
$93/Sq Ft
Est. Value
About This Home
This home is located at 106 Terry Ave, Fitzgerald, GA 31750 and is currently estimated at $110,978, approximately $93 per square foot. 106 Terry Ave is a home located in Ben Hill County with nearby schools including Ben Hill County Primary School, Ben Hill Elementary School, and Ben Hill County Middle School.
Ownership History
Date
Name
Owned For
Owner Type
Purchase Details
Closed on
Jul 1, 2021
Sold by
Harper Louis E
Bought by
L E Harper Commercial Properties Llc
Current Estimated Value
Purchase Details
Closed on
May 26, 2011
Sold by
Harper Louis E
Bought by
Harper Louis E and Harper Jacquelyn D
Purchase Details
Closed on
Oct 5, 2010
Sold by
Georgia Housing And Finance Authority
Bought by
Federal National Mortgage Association
Purchase Details
Closed on
Nov 3, 2006
Sold by
Pelham Scott
Bought by
Cole Christine H
Home Financials for this Owner
Home Financials are based on the most recent Mortgage that was taken out on this home.
Original Mortgage
$61,400
Interest Rate
6.25%
Mortgage Type
New Conventional
Purchase Details
Closed on
Apr 14, 2000
Sold by
Posey Ronald E
Bought by
Pelham Scott
Purchase Details
Closed on
May 18, 1990
Bought by
Posey Ronald E
Create a Home Valuation Report for This Property
The Home Valuation Report is an in-depth analysis detailing your home's value as well as a comparison with similar homes in the area
Home Values in the Area
Average Home Value in this Area
Purchase History
| Date | Buyer | Sale Price | Title Company |
|---|---|---|---|
| L E Harper Commercial Properties Llc | -- | -- | |
| Harper Louis E | -- | -- | |
| Harper Louis E | $43,600 | -- | |
| Federal National Mortgage Association | $62,700 | -- | |
| Cole Christine H | $62,000 | -- | |
| Pelham Scott | $35,000 | -- | |
| Posey Ronald E | $19,100 | -- |
Source: Public Records
Mortgage History
| Date | Status | Borrower | Loan Amount |
|---|---|---|---|
| Previous Owner | Cole Christine H | $61,400 |
Source: Public Records
Tax History Compared to Growth
Tax History
| Year | Tax Paid | Tax Assessment Tax Assessment Total Assessment is a certain percentage of the fair market value that is determined by local assessors to be the total taxable value of land and additions on the property. | Land | Improvement |
|---|---|---|---|---|
| 2024 | $1,077 | $25,247 | $3,200 | $22,047 |
| 2023 | $751 | $24,487 | $3,200 | $21,287 |
| 2022 | $705 | $21,329 | $3,200 | $18,129 |
| 2021 | $668 | $19,448 | $3,200 | $16,248 |
| 2020 | $672 | $19,334 | $3,200 | $16,134 |
| 2019 | $669 | $19,334 | $3,200 | $16,134 |
| 2018 | $823 | $19,099 | $3,200 | $15,899 |
| 2017 | $659 | $18,927 | $3,200 | $15,727 |
| 2016 | $629 | $18,927 | $3,200 | $15,727 |
| 2015 | -- | $18,321 | $3,200 | $15,121 |
| 2014 | -- | $18,321 | $3,200 | $15,121 |
Source: Public Records
Map
Nearby Homes
- 124 Patton Ave
- 118 Patton Ave
- 137 Atlantic Ave
- 109 Pearl Place
- 141 Turner Ave
- 807 W Oconee St
- 118 Irwinville Hwy
- 102 Irwinville Hwy
- 111 Duane Dr
- 816 W Central Ave
- 113 S Merrimac Dr
- 200 Irwinville Hwy
- 906 N Merrimac Dr
- 204 Irwinville Hwy
- 606 W Suwanee St
- 710 W Central Ave
- 613 W Central Ave
- 105 Halsey St
- 615 W Pine St
- 123 Weldon Way
- 151 Ten Mile Rd
- 155 Ten Mile Rd
- 109 Turner Ave
- 112 Terry Ave
- 112 Terry Ave
- 157 Ten Mile Rd
- 103 Terry Ave
- 145 Ten Mile Rd
- 115 Turner Ave
- 114 Terry Ave
- 137 3rd St
- 137 Third (3rd) St
- 113 Terry Ave
- 104 Turner Ave
- 143 Ten Mile Rd
- 108 Turner Ave
- 163 Ten Mile Rd
- 146 Ten Mile Rd
- 156 Ten Mile Rd
- 112 Turner Ave