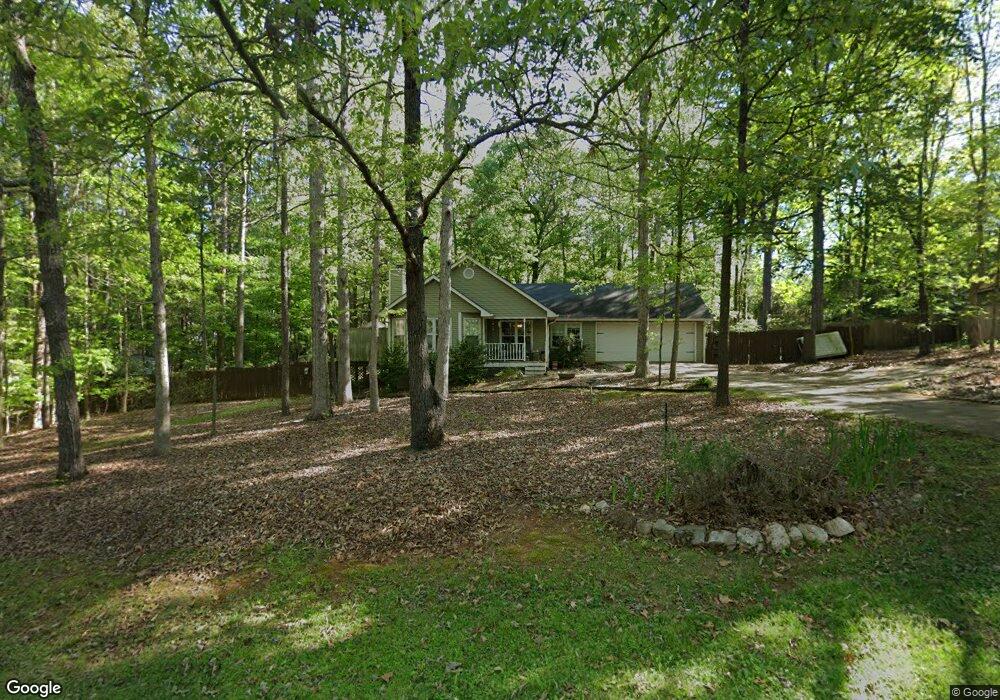
106 Tomrick Ct Bogart, GA 30622
Estimated Value: $238,151 - $371,000
--
Bed
--
Bath
1,416
Sq Ft
$225/Sq Ft
Est. Value
About This Home
This home is located at 106 Tomrick Ct, Bogart, GA 30622 and is currently estimated at $318,038, approximately $224 per square foot. 106 Tomrick Ct is a home located in Clarke County with nearby schools including Cleveland Road Elementary School, Burney-Harris-Lyons Middle School, and Clarke Central High School.
Ownership History
Date
Name
Owned For
Owner Type
Purchase Details
Closed on
Sep 9, 2020
Sold by
Whitlock Elizabeth A
Bought by
Brown Steven Allan and Brown Elizabeth Allison
Current Estimated Value
Purchase Details
Closed on
Nov 23, 2015
Sold by
Whitlock Eddie L
Bought by
Whitlock Elizabeth A
Purchase Details
Closed on
Feb 6, 2015
Sold by
Douglas Karen Wagner
Bought by
Whitlock Eddie L and Whitlock Elizabeth A
Home Financials for this Owner
Home Financials are based on the most recent Mortgage that was taken out on this home.
Original Mortgage
$100,000
Interest Rate
3.81%
Mortgage Type
New Conventional
Purchase Details
Closed on
Aug 15, 2005
Sold by
Douglas Stacy C
Bought by
Douglas Karen Wagner
Purchase Details
Closed on
May 14, 1992
Sold by
Thaxton Byron
Bought by
Douglas Stacy C and Karen Wagner Doug
Purchase Details
Closed on
Oct 30, 1990
Sold by
Glass Roger P
Bought by
Thaxton Byron
Create a Home Valuation Report for This Property
The Home Valuation Report is an in-depth analysis detailing your home's value as well as a comparison with similar homes in the area
Home Values in the Area
Average Home Value in this Area
Purchase History
| Date | Buyer | Sale Price | Title Company |
|---|---|---|---|
| Brown Steven Allan | -- | -- | |
| Whitlock Elizabeth A | -- | -- | |
| Whitlock Eddie L | $125,000 | -- | |
| Douglas Karen Wagner | -- | -- | |
| Douglas Stacy C | $73,500 | -- | |
| Thaxton Byron | $8,500 | -- |
Source: Public Records
Mortgage History
| Date | Status | Borrower | Loan Amount |
|---|---|---|---|
| Previous Owner | Whitlock Eddie L | $100,000 |
Source: Public Records
Tax History Compared to Growth
Tax History
| Year | Tax Paid | Tax Assessment Tax Assessment Total Assessment is a certain percentage of the fair market value that is determined by local assessors to be the total taxable value of land and additions on the property. | Land | Improvement |
|---|---|---|---|---|
| 2025 | $1,594 | $99,886 | $12,000 | $87,886 |
| 2024 | $1,594 | $93,178 | $12,000 | $81,178 |
| 2023 | $480 | $91,100 | $12,000 | $79,100 |
| 2022 | $1,601 | $74,341 | $10,400 | $63,941 |
| 2021 | $1,511 | $61,412 | $10,400 | $51,012 |
| 2020 | $1,427 | $55,253 | $10,400 | $44,853 |
| 2019 | $1,421 | $53,990 | $10,400 | $43,590 |
| 2018 | $1,370 | $50,344 | $10,400 | $39,944 |
| 2017 | $0 | $49,904 | $10,400 | $39,504 |
| 2016 | $1,258 | $47,044 | $10,400 | $36,644 |
| 2015 | $1,245 | $46,592 | $10,400 | $36,192 |
| 2014 | $948 | $37,820 | $10,400 | $27,420 |
Source: Public Records
Map
Nearby Homes
- 105 Tomrick Ct
- 2464 Savage Rd
- 1715 Whistling Creek Crossing Unit Lot 21
- 0 Marko Dr Unit 1024157
- 119 S Church St
- 159 Pine Valley Rd
- 325 Twin Oaks Cir
- 2616 Rat Kinney Rd
- 110 Chad Walk Unit 56
- 125 Chad Walk Unit 61
- 158 Chad Walk Unit 58
- 140 Chad Walk Unit 57
- 160 Chad Walk Unit 59
- 405 Rapids Dr
- 2188 Day Dr
- 130 Abby Ln
- 112 Tomrick Ct
- 120 S Arcadia Dr
- 110 S Arcadia Dr
- 195 Bob Wages Rd
- 130 S Arcadia Dr
- 127 Montclair Ct
- 116 Tomrick Ct
- S S Arcadia Dr
- 111 Tomrick Ct
- 107 Montclair Ct
- 100 S Arcadia Dr
- 140 S Arcadia Dr
- 115 S Arcadia Dr
- 137 Montclair Ct
- 125 S Arcadia Dr
- 0 Montclair Ct Unit 1 8377117
- 111 S Arcadia Dr
- 135 S Arcadia Dr
- 150 S Arcadia Dr
- 110 Montclair Ct