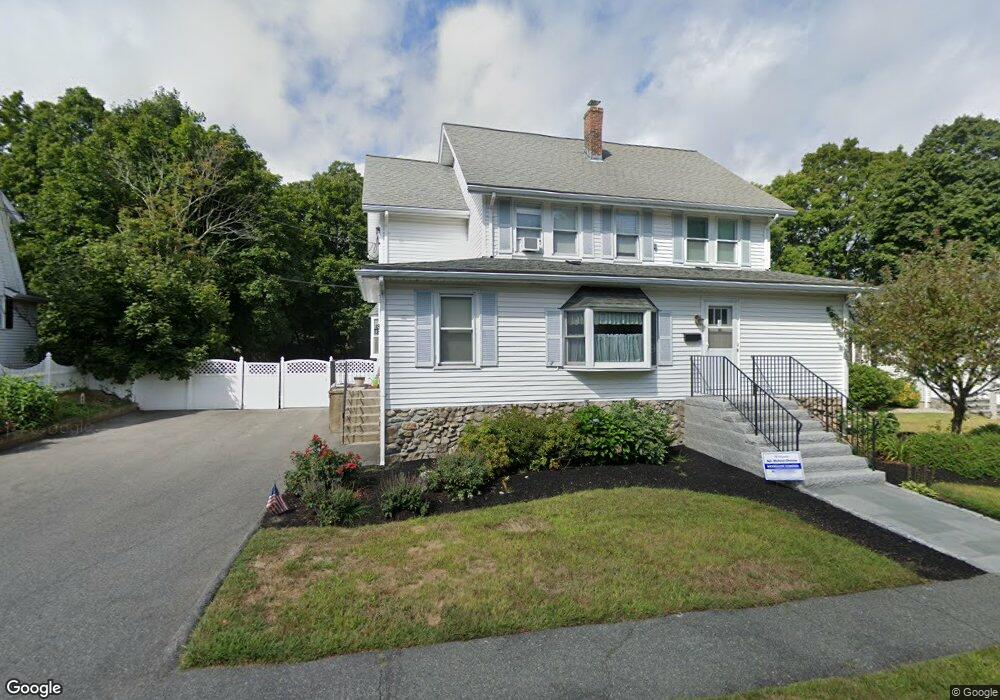
106 Torrey St South Weymouth, MA 02190
Estimated Value: $702,746 - $843,000
4
Beds
2
Baths
2,267
Sq Ft
$349/Sq Ft
Est. Value
About This Home
This home is located at 106 Torrey St, South Weymouth, MA 02190 and is currently estimated at $790,187, approximately $348 per square foot. 106 Torrey St is a home located in Norfolk County with nearby schools including Ralph Talbot Primary School, Abigail Adams Middle School, and Weymouth Middle School Chapman.
Ownership History
Date
Name
Owned For
Owner Type
Purchase Details
Closed on
Jul 15, 2015
Sold by
Nichols Suzanne N
Bought by
Sn Rt
Current Estimated Value
Purchase Details
Closed on
Jul 21, 1988
Sold by
Sousa Alfred A
Bought by
Nichols John G
Home Financials for this Owner
Home Financials are based on the most recent Mortgage that was taken out on this home.
Original Mortgage
$180,000
Interest Rate
10.49%
Mortgage Type
Purchase Money Mortgage
Create a Home Valuation Report for This Property
The Home Valuation Report is an in-depth analysis detailing your home's value as well as a comparison with similar homes in the area
Home Values in the Area
Average Home Value in this Area
Purchase History
| Date | Buyer | Sale Price | Title Company |
|---|---|---|---|
| Sn Rt | -- | -- | |
| Nichols John G | $200,000 | -- |
Source: Public Records
Mortgage History
| Date | Status | Borrower | Loan Amount |
|---|---|---|---|
| Previous Owner | Nichols John G | $180,000 |
Source: Public Records
Tax History Compared to Growth
Tax History
| Year | Tax Paid | Tax Assessment Tax Assessment Total Assessment is a certain percentage of the fair market value that is determined by local assessors to be the total taxable value of land and additions on the property. | Land | Improvement |
|---|---|---|---|---|
| 2025 | $6,125 | $606,400 | $227,900 | $378,500 |
| 2024 | $5,933 | $577,700 | $217,100 | $360,600 |
| 2023 | $5,938 | $568,200 | $219,300 | $348,900 |
| 2022 | $5,778 | $504,200 | $203,000 | $301,200 |
| 2021 | $5,554 | $473,100 | $203,000 | $270,100 |
| 2020 | $5,371 | $450,600 | $203,000 | $247,600 |
| 2019 | $5,239 | $432,300 | $195,200 | $237,100 |
| 2018 | $4,850 | $388,000 | $185,900 | $202,100 |
| 2017 | $4,628 | $361,300 | $177,100 | $184,200 |
| 2016 | $4,348 | $339,700 | $170,300 | $169,400 |
| 2015 | $4,186 | $324,500 | $170,300 | $154,200 |
| 2014 | $4,098 | $308,100 | $158,500 | $149,600 |
Source: Public Records
Map
Nearby Homes
- 27 Park Ave
- 740-742 Main St
- 261 Pleasant St Unit 5
- 261 Pleasant St Unit 4
- 685 Main St Unit 3
- 2 Mitchell Ln Unit B
- 45 Union St
- 30 Alroy Rd
- 120 Burkhall St Unit K
- 54 Old Quarry Dr
- 1641/1645 Main St
- 11 White St
- 200 Burkhall St Unit 803
- 200 Burkhall St Unit 103
- 77 Randolph St
- 159 Tall Oaks Dr Unit D
- 1050 Main St Unit 1
- 65 Fountain Ln Unit 4
- 121 Tall Oaks Dr Unit Q
- 103 King Philip St