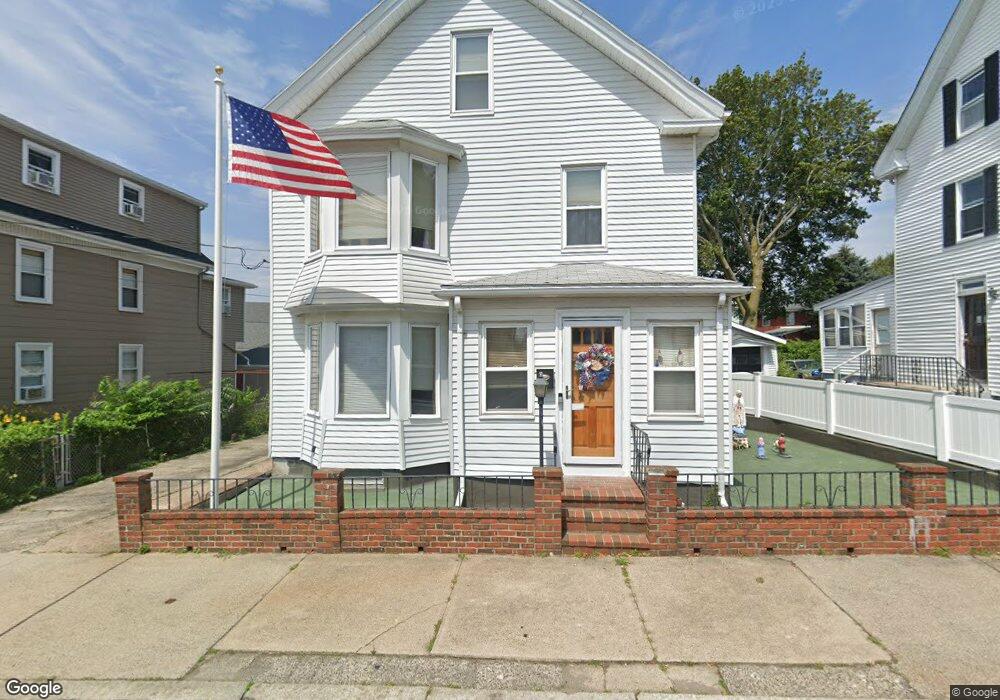
106 Tremont St Peabody, MA 01960
Peabody Town Center NeighborhoodEstimated Value: $675,572 - $782,000
4
Beds
3
Baths
2,170
Sq Ft
$334/Sq Ft
Est. Value
About This Home
This home is located at 106 Tremont St, Peabody, MA 01960 and is currently estimated at $725,143, approximately $334 per square foot. 106 Tremont St is a home located in Essex County with nearby schools including Peabody Veterans Memorial High School, St John The Baptist School, and The Phoenix School.
Ownership History
Date
Name
Owned For
Owner Type
Purchase Details
Closed on
Mar 10, 2004
Sold by
Quadros Maria L
Bought by
Quadros Tr Maria L
Current Estimated Value
Purchase Details
Closed on
Oct 13, 1989
Sold by
Martineau John
Bought by
Carrero Ralph
Home Financials for this Owner
Home Financials are based on the most recent Mortgage that was taken out on this home.
Original Mortgage
$107,300
Interest Rate
10.13%
Mortgage Type
Purchase Money Mortgage
Create a Home Valuation Report for This Property
The Home Valuation Report is an in-depth analysis detailing your home's value as well as a comparison with similar homes in the area
Home Values in the Area
Average Home Value in this Area
Purchase History
| Date | Buyer | Sale Price | Title Company |
|---|---|---|---|
| Quadros Tr Maria L | -- | -- | |
| Carrero Ralph | $113,400 | -- |
Source: Public Records
Mortgage History
| Date | Status | Borrower | Loan Amount |
|---|---|---|---|
| Previous Owner | Carrero Ralph | $107,300 |
Source: Public Records
Tax History
| Year | Tax Paid | Tax Assessment Tax Assessment Total Assessment is a certain percentage of the fair market value that is determined by local assessors to be the total taxable value of land and additions on the property. | Land | Improvement |
|---|---|---|---|---|
| 2025 | $5,500 | $594,000 | $173,500 | $420,500 |
| 2024 | $5,566 | $610,300 | $173,500 | $436,800 |
| 2023 | $4,985 | $523,600 | $150,900 | $372,700 |
| 2022 | $4,749 | $470,200 | $134,700 | $335,500 |
| 2021 | $4,412 | $420,600 | $122,500 | $298,100 |
| 2020 | $4,250 | $395,700 | $122,500 | $273,200 |
| 2019 | $3,909 | $355,000 | $122,500 | $232,500 |
| 2018 | $3,548 | $309,600 | $115,500 | $194,100 |
| 2017 | $3,394 | $288,600 | $115,500 | $173,100 |
| 2016 | $3,322 | $278,700 | $115,500 | $163,200 |
| 2015 | $3,172 | $257,900 | $115,500 | $142,400 |
Source: Public Records
Map
Nearby Homes
- 30 Driscoll St
- 41 Northend St
- 75 Walnut St Unit 315
- 9 Highland St
- 8 Cushing St Unit 2
- 16 Oakland St
- 68 Beaver St
- 16 Tremont St
- 145 Boston St
- 128 Boston St Unit 4
- 10 Park St
- 20 Beacon St
- 1 Fountain St
- 111 Mason St
- 27 Liberty Hill Ave
- 107 Mason St
- 15 Wall St
- 40 Buffum St Unit 2
- 40 Buffum St Unit 1
- 2 Osborne St
Your Personal Tour Guide
Ask me questions while you tour the home.