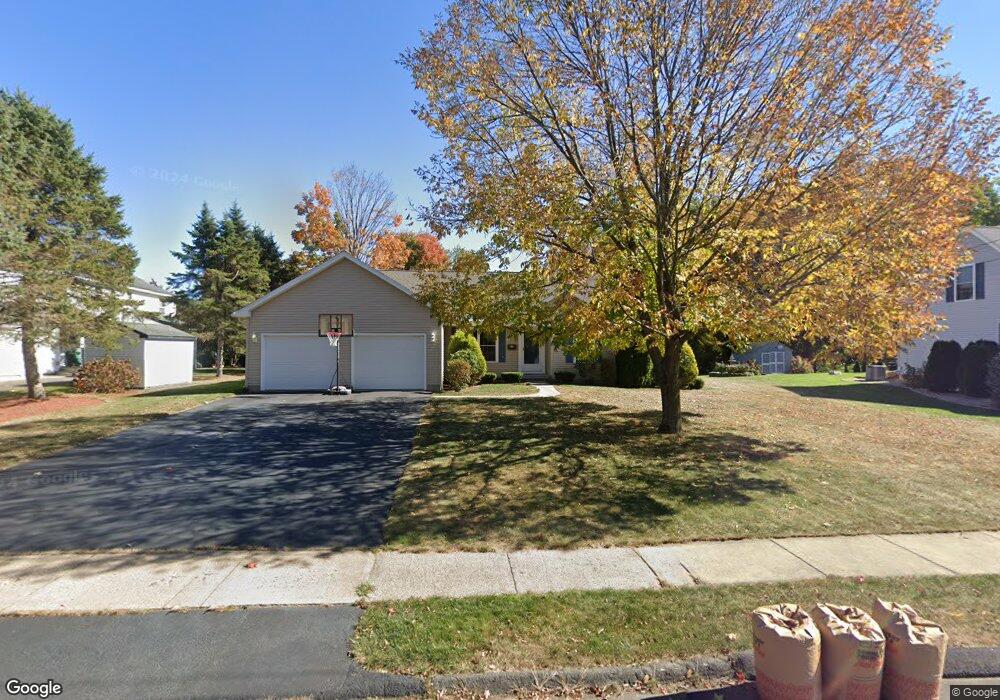
106 Valmore Rd Bristol, CT 06010
North Bristol NeighborhoodEstimated Value: $436,543 - $521,000
3
Beds
3
Baths
1,714
Sq Ft
$273/Sq Ft
Est. Value
About This Home
This home is located at 106 Valmore Rd, Bristol, CT 06010 and is currently estimated at $467,386, approximately $272 per square foot. 106 Valmore Rd is a home located in Hartford County with nearby schools including Edgewood School, Chippens Hill Middle School, and Bristol Eastern High School.
Ownership History
Date
Name
Owned For
Owner Type
Purchase Details
Closed on
Mar 18, 2008
Sold by
Loveland Robert
Bought by
Dorman Jason G and Dorman Lori A
Current Estimated Value
Home Financials for this Owner
Home Financials are based on the most recent Mortgage that was taken out on this home.
Original Mortgage
$175,000
Interest Rate
5.72%
Create a Home Valuation Report for This Property
The Home Valuation Report is an in-depth analysis detailing your home's value as well as a comparison with similar homes in the area
Home Values in the Area
Average Home Value in this Area
Purchase History
| Date | Buyer | Sale Price | Title Company |
|---|---|---|---|
| Dorman Jason G | $315,000 | -- |
Source: Public Records
Mortgage History
| Date | Status | Borrower | Loan Amount |
|---|---|---|---|
| Open | Dorman Jason G | $170,466 | |
| Closed | Dorman Jason G | $175,000 |
Source: Public Records
Tax History
| Year | Tax Paid | Tax Assessment Tax Assessment Total Assessment is a certain percentage of the fair market value that is determined by local assessors to be the total taxable value of land and additions on the property. | Land | Improvement |
|---|---|---|---|---|
| 2025 | $7,680 | $227,570 | $52,150 | $175,420 |
| 2024 | $7,248 | $227,570 | $52,150 | $175,420 |
| 2023 | $6,907 | $227,570 | $52,150 | $175,420 |
| 2022 | $6,319 | $164,780 | $36,190 | $128,590 |
| 2021 | $6,319 | $164,780 | $36,190 | $128,590 |
| 2020 | $6,319 | $164,780 | $36,190 | $128,590 |
| 2019 | $6,270 | $164,780 | $36,190 | $128,590 |
| 2018 | $6,077 | $164,780 | $36,190 | $128,590 |
| 2017 | $6,083 | $168,840 | $51,730 | $117,110 |
| 2016 | $5,952 | $165,200 | $51,730 | $113,470 |
| 2015 | $5,718 | $165,200 | $51,730 | $113,470 |
| 2014 | $5,718 | $165,200 | $51,730 | $113,470 |
Source: Public Records
Map
Nearby Homes
- 135 Jerome Ave
- 101 Vincent Rd
- 90 Orleans Dr
- 30 Adeline Ave
- 64 Fanway Ave
- 175 Moody St
- 19 Woodside Way
- 941 Farmington Ave
- 354 Maple Ave
- 0 Fairlawn St
- 3 Sandra St
- 20 Westchester Dr
- 1 Hickory St
- 380 Burlington Ave
- 162 Ben St
- 209 Ashley Rd
- 55 Beths Ave Unit 77
- 97 Jacqueline Dr
- 35 Lardner Rd
- 169 Morningside Dr E
Your Personal Tour Guide
Ask me questions while you tour the home.