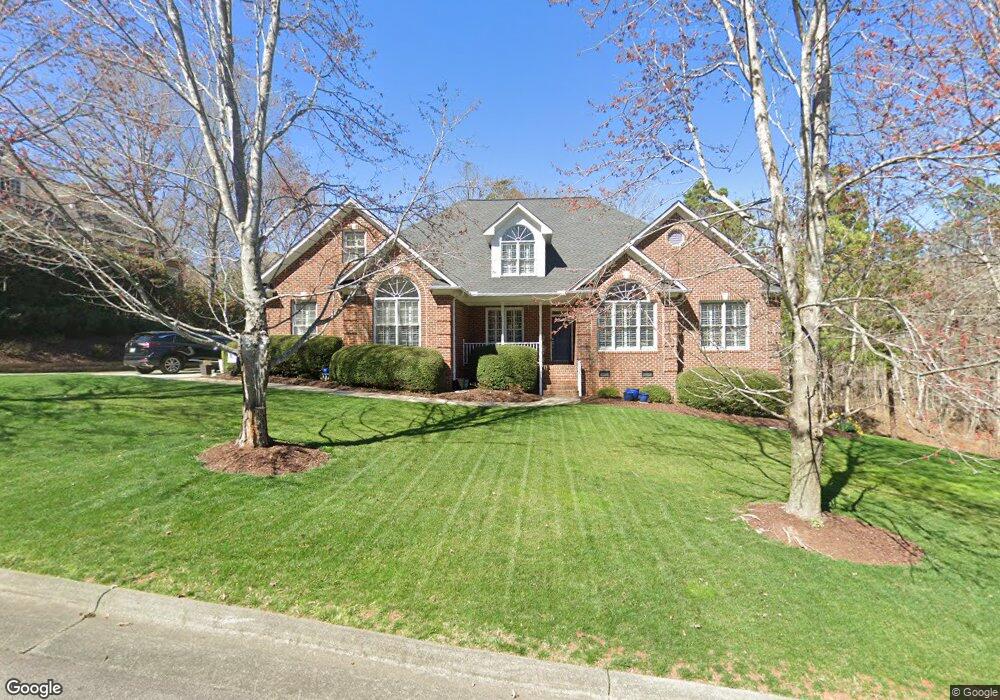
106 Vanderbilt Ct Durham, NC 27705
Croasdaile NeighborhoodEstimated Value: $856,000 - $1,137,000
4
Beds
4
Baths
3,510
Sq Ft
$281/Sq Ft
Est. Value
About This Home
This home is located at 106 Vanderbilt Ct, Durham, NC 27705 and is currently estimated at $985,230, approximately $280 per square foot. 106 Vanderbilt Ct is a home located in Durham County with nearby schools including Hillandale Elementary School, George L Carrington Middle, and Riverside High School.
Ownership History
Date
Name
Owned For
Owner Type
Purchase Details
Closed on
Jun 14, 2013
Sold by
Hine Frederick Clifford
Bought by
Hine Frederick Clifford and Hine Betsy Anne
Current Estimated Value
Purchase Details
Closed on
Feb 26, 2013
Sold by
Bonaparte Yvette Lynne
Bought by
Hine Frederick Clifford
Home Financials for this Owner
Home Financials are based on the most recent Mortgage that was taken out on this home.
Original Mortgage
$185,000
Outstanding Balance
$129,897
Interest Rate
3.43%
Mortgage Type
New Conventional
Estimated Equity
$855,333
Purchase Details
Closed on
Feb 9, 2005
Sold by
J M Kelly Construction Inc
Bought by
Bonaparte Yvette Lynne
Home Financials for this Owner
Home Financials are based on the most recent Mortgage that was taken out on this home.
Original Mortgage
$65,985
Interest Rate
5.68%
Mortgage Type
Credit Line Revolving
Create a Home Valuation Report for This Property
The Home Valuation Report is an in-depth analysis detailing your home's value as well as a comparison with similar homes in the area
Home Values in the Area
Average Home Value in this Area
Purchase History
| Date | Buyer | Sale Price | Title Company |
|---|---|---|---|
| Hine Frederick Clifford | -- | None Available | |
| Hine Frederick Clifford | $385,000 | None Available | |
| Bonaparte Yvette Lynne | $440,000 | -- |
Source: Public Records
Mortgage History
| Date | Status | Borrower | Loan Amount |
|---|---|---|---|
| Open | Hine Frederick Clifford | $185,000 | |
| Previous Owner | Bonaparte Yvette Lynne | $65,985 | |
| Previous Owner | Bonaparte Yvette Lynne | $351,920 |
Source: Public Records
Tax History
| Year | Tax Paid | Tax Assessment Tax Assessment Total Assessment is a certain percentage of the fair market value that is determined by local assessors to be the total taxable value of land and additions on the property. | Land | Improvement |
|---|---|---|---|---|
| 2025 | $8,477 | $971,278 | $139,000 | $832,278 |
| 2024 | $6,566 | $470,707 | $104,175 | $366,532 |
| 2023 | $6,166 | $470,707 | $104,175 | $366,532 |
| 2022 | $6,025 | $470,707 | $104,175 | $366,532 |
| 2021 | $5,996 | $470,707 | $104,175 | $366,532 |
| 2020 | $5,855 | $470,707 | $104,175 | $366,532 |
| 2019 | $5,855 | $470,707 | $104,175 | $366,532 |
| 2018 | $6,448 | $475,314 | $104,175 | $371,139 |
| 2017 | $6,400 | $475,314 | $104,175 | $371,139 |
| 2016 | $6,184 | $520,945 | $104,175 | $416,770 |
| 2015 | $6,973 | $503,688 | $98,221 | $405,467 |
| 2014 | $6,973 | $503,688 | $98,221 | $405,467 |
Source: Public Records
Map
Nearby Homes
- 3710 Dairy Pond Place
- 1513 Cole Mill Rd
- 3735 Stoneybrook Dr
- 524 Soapstone Dr
- 1011 Coldspring Cir
- 1005 Coldspring Cir
- 1001 Coldspring Cir
- 1003 Coldspring Cir
- 1047 Coldspring Cir
- 1214 E Oak Dr
- 6 Webster Ct
- 2104 Skipping Stone Dr
- 1009 Crescent Moon Ct
- 1217 Opal Ln
- 1221 Opal Ln
- 605 Blackwood Ct
- 209 Old Mill Place
- 1229 Opal Ln
- 105 Old Mill Place
- 104 Old Mill Place
- 2104 Greenwich Place
- 2106 Greenwich Place
- 102 Vanderbilt Ct
- 111 Vanderbilt Ct
- 2108 Greenwich Place
- 107 Vanderbilt Ct
- 115 Vanderbilt Ct
- 103 Vanderbilt Ct
- 201 Vanderbilt Ct
- 2103 Greenwich Place
- 2105 Greenwich Place
- 2112 Greenwich Place
- 2107 Greenwich Place
- 205 Vanderbilt Ct
- 29 Quail Ridge Rd
- 31 Quail Ridge Rd
- 208 Vanderbilt Ct
- 2111 Greenwich Place
- 209 Vanderbilt Ct
- 25 Quail Ridge Rd
Your Personal Tour Guide
Ask me questions while you tour the home.