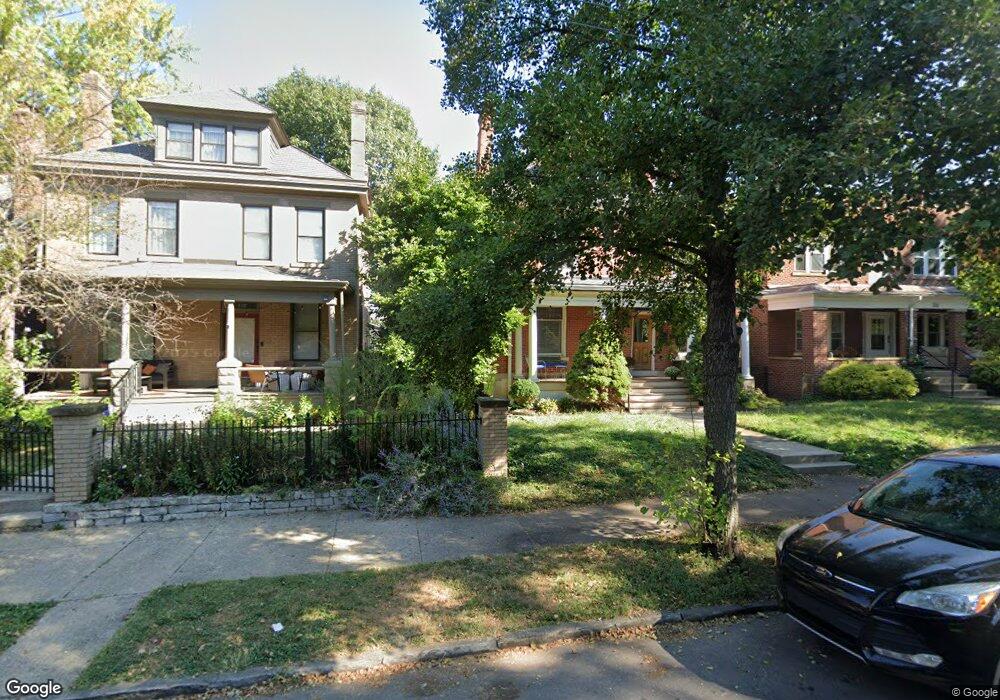
106 W 2nd Ave Unit 106 Columbus, OH 43201
Short North NeighborhoodEstimated Value: $358,000 - $608,000
3
Beds
2
Baths
1,985
Sq Ft
$248/Sq Ft
Est. Value
About This Home
This home is located at 106 W 2nd Ave Unit 106, Columbus, OH 43201 and is currently estimated at $492,652, approximately $248 per square foot. 106 W 2nd Ave Unit 106 is a home located in Franklin County with nearby schools including Hubbard Elementary School, Dominion Middle School, and Whetstone High School.
Ownership History
Date
Name
Owned For
Owner Type
Purchase Details
Closed on
May 26, 2010
Sold by
Earley Matthew E and Earley Lisa G
Bought by
Staker Matthew S
Current Estimated Value
Home Financials for this Owner
Home Financials are based on the most recent Mortgage that was taken out on this home.
Original Mortgage
$202,000
Outstanding Balance
$136,505
Interest Rate
5.14%
Mortgage Type
New Conventional
Estimated Equity
$356,147
Purchase Details
Closed on
May 13, 2005
Sold by
Generation Rentals Ltd
Bought by
Earley Matthew E and Earley Lisa G
Home Financials for this Owner
Home Financials are based on the most recent Mortgage that was taken out on this home.
Original Mortgage
$248,000
Interest Rate
6.07%
Mortgage Type
Fannie Mae Freddie Mac
Purchase Details
Closed on
Jun 1, 1995
Sold by
Boice David G
Bought by
Dunlap Barbara J
Create a Home Valuation Report for This Property
The Home Valuation Report is an in-depth analysis detailing your home's value as well as a comparison with similar homes in the area
Home Values in the Area
Average Home Value in this Area
Purchase History
| Date | Buyer | Sale Price | Title Company |
|---|---|---|---|
| Staker Matthew S | $252,500 | Amerititle | |
| Earley Matthew E | $248,000 | Amerititle | |
| Dunlap Barbara J | $120,000 | -- |
Source: Public Records
Mortgage History
| Date | Status | Borrower | Loan Amount |
|---|---|---|---|
| Open | Staker Matthew S | $202,000 | |
| Previous Owner | Earley Matthew E | $248,000 |
Source: Public Records
Tax History Compared to Growth
Tax History
| Year | Tax Paid | Tax Assessment Tax Assessment Total Assessment is a certain percentage of the fair market value that is determined by local assessors to be the total taxable value of land and additions on the property. | Land | Improvement |
|---|---|---|---|---|
| 2024 | $5,707 | $127,160 | $28,000 | $99,160 |
| 2023 | $5,634 | $127,160 | $28,000 | $99,160 |
| 2022 | $5,947 | $114,660 | $23,100 | $91,560 |
| 2021 | $5,957 | $114,660 | $23,100 | $91,560 |
| 2020 | $5,965 | $114,660 | $23,100 | $91,560 |
| 2019 | $6,323 | $104,230 | $21,000 | $83,230 |
| 2018 | $6,118 | $104,230 | $21,000 | $83,230 |
| 2017 | $6,319 | $104,230 | $21,000 | $83,230 |
| 2016 | $6,529 | $98,560 | $20,020 | $78,540 |
| 2015 | $5,927 | $98,560 | $20,020 | $78,540 |
| 2014 | $5,941 | $98,560 | $20,020 | $78,540 |
| 2013 | $2,522 | $84,840 | $13,440 | $71,400 |
Source: Public Records
Map
Nearby Homes
- 1001 Dennison Ave
- 162 E 2nd Ave
- 998 Ewing Alley Unit 998
- 915 Dennison Ave Unit 915
- 83 W 1st Ave
- 938 Hunter Ave
- 85-91 W 1st Ave
- 969 Hunter Ave
- 17 W 3rd Ave Unit 212
- 17 W 3rd Ave Unit 213
- 1025 Hunter Ave
- 986 Highland St
- 11 W 1st Ave Unit B
- 845 N High St Unit 404
- 845 N High St Unit 209
- 845 N High St Unit 501 & 502
- 1016 Neil Ave
- 1018 Neil Ave
- 884 Neil Ave
- 1042 Neil Ave
- 104 W 2nd Ave Unit 104
- 100 W 2nd Ave Unit 4
- 100 W 2nd Ave Unit 1
- 100 W 2nd Ave
- 100 W 2nd Ave Unit 2
- 110 W 2nd Ave
- 114 W 2nd Ave Unit 116
- 96 W 2nd Ave
- 116 W 2nd Ave
- 116 W 2nd Ave Unit 116
- 94 W 2nd Ave Unit 96
- 90 W 2nd Ave
- 122 W 2nd Ave
- 84 W 2nd Ave
- 128 W 2nd Ave
- 99 1/2 W 2nd Ave
- 115 W 2nd Ave
- 115 W 2nd Ave Unit B
- 115 W 2nd Ave Unit A
- 115 W 2nd Ave