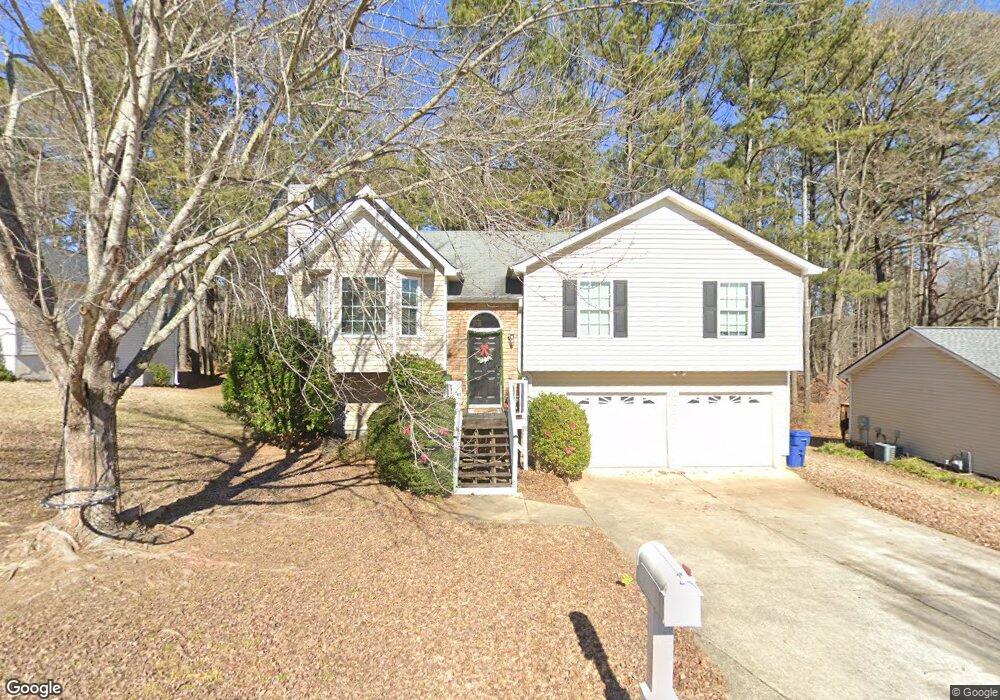
106 W Bridge Dr Dallas, GA 30157
Estimated Value: $245,000 - $293,000
4
Beds
3
Baths
1,238
Sq Ft
$223/Sq Ft
Est. Value
About This Home
This home is located at 106 W Bridge Dr, Dallas, GA 30157 and is currently estimated at $276,638, approximately $223 per square foot. 106 W Bridge Dr is a home located in Paulding County with nearby schools including Allgood Elementary School, Herschel Jones Middle School, and Paulding County High School.
Ownership History
Date
Name
Owned For
Owner Type
Purchase Details
Closed on
Jan 28, 2022
Sold by
Boulton Properties Llc
Bought by
New Residential Borrower 2022 Sfr1
Current Estimated Value
Purchase Details
Closed on
Mar 31, 2021
Sold by
S Nelson Family Llc
Bought by
Boulton Properties Llc
Purchase Details
Closed on
Feb 11, 2011
Sold by
2007-Mlmn1 Wells Fargo
Bought by
S-Nelson Family Llc
Purchase Details
Closed on
Jun 1, 2010
Sold by
Bivens Lamonyca D
Bought by
Wells Fargo Bk Sasco 2007-Mln1
Purchase Details
Closed on
Sep 29, 2006
Sold by
Race Const Inc
Bought by
Bivens Lamonyca D
Home Financials for this Owner
Home Financials are based on the most recent Mortgage that was taken out on this home.
Original Mortgage
$117,200
Interest Rate
8.05%
Mortgage Type
New Conventional
Create a Home Valuation Report for This Property
The Home Valuation Report is an in-depth analysis detailing your home's value as well as a comparison with similar homes in the area
Home Values in the Area
Average Home Value in this Area
Purchase History
| Date | Buyer | Sale Price | Title Company |
|---|---|---|---|
| New Residential Borrower 2022 Sfr1 | -- | -- | |
| Boulton Properties Llc | -- | -- | |
| S-Nelson Family Llc | $60,000 | -- | |
| Wells Fargo Bk Sasco 2007-Mln1 | $69,750 | -- | |
| Bivens Lamonyca D | $146,500 | -- |
Source: Public Records
Mortgage History
| Date | Status | Borrower | Loan Amount |
|---|---|---|---|
| Previous Owner | Bivens Lamonyca D | $117,200 |
Source: Public Records
Tax History Compared to Growth
Tax History
| Year | Tax Paid | Tax Assessment Tax Assessment Total Assessment is a certain percentage of the fair market value that is determined by local assessors to be the total taxable value of land and additions on the property. | Land | Improvement |
|---|---|---|---|---|
| 2024 | $3,304 | $105,880 | $12,000 | $93,880 |
| 2023 | $3,117 | $103,080 | $12,000 | $91,080 |
| 2022 | $1,963 | $96,200 | $12,000 | $84,200 |
| 2021 | $2,109 | $72,560 | $12,000 | $60,560 |
| 2020 | $2,227 | $65,760 | $12,000 | $53,760 |
| 2019 | $2,063 | $60,160 | $12,000 | $48,160 |
| 2018 | $1,699 | $56,400 | $12,000 | $44,400 |
| 2017 | $1,771 | $51,000 | $12,000 | $39,000 |
| 2016 | $1,598 | $46,440 | $12,000 | $34,440 |
| 2015 | $1,238 | $40,240 | $8,000 | $32,240 |
| 2014 | $1,188 | $37,640 | $8,000 | $29,640 |
| 2013 | -- | $26,000 | $8,000 | $18,000 |
Source: Public Records
Map
Nearby Homes
- 361 West Ave
- 0 Cole Lake Rd Unit 7651259
- 0 Cole Lake Rd Unit 10607141
- 60 Westside Cir
- 298 Buchanan Hwy
- 1119 W Memorial Dr
- 212 Remington Place Blvd
- 380 Buchanan Hwy
- 102 Natalie Ct
- 305 Remington Place Blvd
- 107 Salem Place
- Robie Plan at Oakleigh Glen
- Penwell Plan at Oakleigh Glen
- Belhaven Plan at Oakleigh Glen
- Darwin Plan at Oakleigh Glen
- Aria Plan at Oakleigh Glen
- 217 Victory Dr
- 0 Jimmy Campbell Pkwy Unit 10556704
- 0 Jimmy Campbell Pkwy Unit 7607737
- 412 Oak View Ln
- 104 W Bridge Dr
- 108 W Bridge Dr
- 105 W Bridge Dr
- 110 W Bridge Dr
- 101 W Bridge Ct Unit 101
- 101 W Bridge Ct Unit 1
- 101 W Bridge Ct
- 102 W Bridge Dr
- W W Bridge Ct
- 101 W Bridge Dr
- 100 W Bridge Dr
- 200 W Bridge Dr Unit 1
- 890 West Ave
- 103 W Bridge Ct
- 834 West Ave
- 0 W Bridge Dr Unit 7275555
- 0 W Bridge Dr Unit 7126304
- 0 W Bridge Dr Unit 3186460
- 0 W Bridge Dr Unit 8455579
- 0 W Bridge Dr Unit 8037079