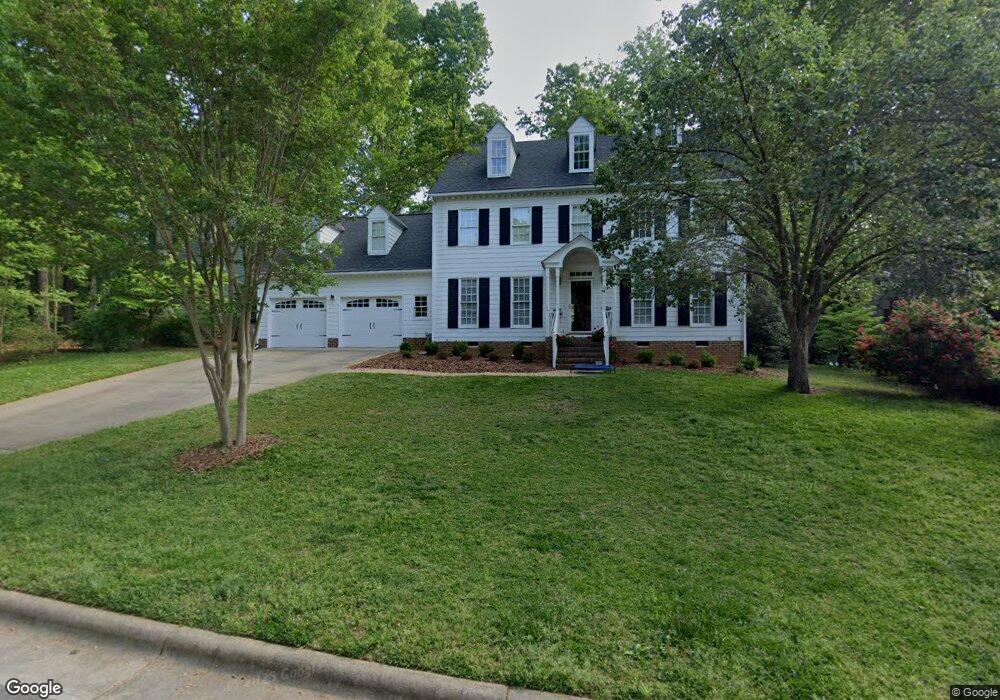
106 W Gerrell Ct Cary, NC 27511
South Cary NeighborhoodEstimated Value: $596,000 - $719,000
3
Beds
3
Baths
2,911
Sq Ft
$219/Sq Ft
Est. Value
About This Home
This home is located at 106 W Gerrell Ct, Cary, NC 27511 and is currently estimated at $637,187, approximately $218 per square foot. 106 W Gerrell Ct is a home located in Wake County with nearby schools including Farmington Woods Elementary, East Cary Middle School, and Cary High School.
Ownership History
Date
Name
Owned For
Owner Type
Purchase Details
Closed on
Nov 15, 2017
Sold by
Gaylog Kurt R and Gaylog Laurie A
Bought by
Estrella Roberto F and Volz Amanda Ann
Current Estimated Value
Home Financials for this Owner
Home Financials are based on the most recent Mortgage that was taken out on this home.
Original Mortgage
$344,850
Outstanding Balance
$288,968
Interest Rate
3.85%
Mortgage Type
New Conventional
Estimated Equity
$348,219
Purchase Details
Closed on
Jul 30, 2015
Sold by
Ritter Sarah Lynne
Bought by
Gyalog Kurt R and Gyalog Laureie A
Home Financials for this Owner
Home Financials are based on the most recent Mortgage that was taken out on this home.
Original Mortgage
$315,400
Interest Rate
4.04%
Mortgage Type
New Conventional
Purchase Details
Closed on
Jan 17, 1998
Sold by
Lamb James V
Bought by
Lamb Ii James Vanty and Ritter Sarah Lynne
Purchase Details
Closed on
Feb 28, 1997
Bought by
Ritter Sarah L
Create a Home Valuation Report for This Property
The Home Valuation Report is an in-depth analysis detailing your home's value as well as a comparison with similar homes in the area
Home Values in the Area
Average Home Value in this Area
Purchase History
| Date | Buyer | Sale Price | Title Company |
|---|---|---|---|
| Estrella Roberto F | $363,000 | None Available | |
| Gyalog Kurt R | $332,000 | Attorney | |
| Lamb Ii James Vanty | -- | -- | |
| Ritter Sarah L | $205,000 | -- |
Source: Public Records
Mortgage History
| Date | Status | Borrower | Loan Amount |
|---|---|---|---|
| Open | Estrella Roberto F | $344,850 | |
| Previous Owner | Gyalog Kurt R | $315,400 |
Source: Public Records
Tax History
| Year | Tax Paid | Tax Assessment Tax Assessment Total Assessment is a certain percentage of the fair market value that is determined by local assessors to be the total taxable value of land and additions on the property. | Land | Improvement |
|---|---|---|---|---|
| 2025 | $4,964 | $576,777 | $220,000 | $356,777 |
| 2024 | $4,856 | $576,777 | $220,000 | $356,777 |
Source: Public Records
Map
Nearby Homes
- 111 Bonner Ct
- 1205 Seabrook Ave
- 807 Ellynn Dr
- 604 Ashe Ave
- 1224 Collington Dr
- 1209 Willowbrook Dr
- 1103 Warren Ave
- 1414 Debra Dr
- 1208 Walnut St
- 908 Tanglewood Dr
- 1216 Walnut St
- 1722 Seabrook Ave
- 132 New Kent Place Unit 132
- 1331 Kingston Ridge Rd
- 1641 Kildonan Place
- 1009 Wilshire Dr
- 1017 Thistle Briar Place
- 149 Glenpark Place
- 1001 Wilshire Dr
- 102 Shriver Ct
- 104 W Gerrell Ct
- 108 W Gerrell Ct
- 208 Greenwood Cir
- 102 W Gerrell Ct
- 109 W Gerrell Ct
- 110 W Gerrell Ct
- 111 W Gerrell Ct
- 206 Greenwood Cir
- 100 Abram Dr
- 300 Greenwood Cir
- 302 Greenwood Cir
- 112 W Gerrell Ct
- 113 W Gerrell Ct
- 102 Exeter Ct
- 114 W Gerrell Ct
- 101 Abram Dr
- 204 Greenwood Cir
- 103 Exeter Ct
- 115 W Gerrell Ct
- 102 Abram Dr
Your Personal Tour Guide
Ask me questions while you tour the home.