Estimated Value: $391,000 - $667,000
3
Beds
1
Bath
1,081
Sq Ft
$499/Sq Ft
Est. Value
About This Home
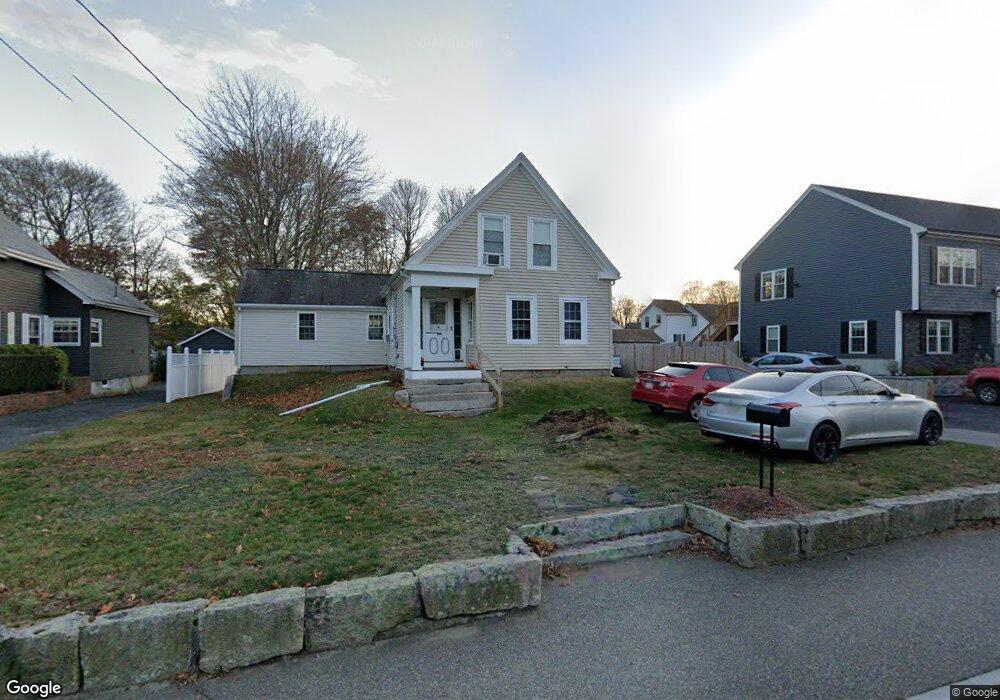
This home is located at 106 W High St, Avon, MA 02322 and is currently estimated at $539,481, approximately $499 per square foot. 106 W High St is a home located in Norfolk County with nearby schools including Ralph D. Butler Elementary School, Avon Middle/High School, and Lighthouse Baptist Christian Academy.
Ownership History
Date
Name
Owned For
Owner Type
Purchase Details
Closed on
Feb 1, 2002
Sold by
Boen James A
Bought by
Mcgovern Leo J and Mcgovern Krista R
Current Estimated Value
Home Financials for this Owner
Home Financials are based on the most recent Mortgage that was taken out on this home.
Original Mortgage
$197,600
Outstanding Balance
$82,225
Interest Rate
7.15%
Mortgage Type
Purchase Money Mortgage
Estimated Equity
$457,256
Purchase Details
Closed on
Aug 3, 2001
Sold by
Avon Town Of
Bought by
Boen James A
Create a Home Valuation Report for This Property
The Home Valuation Report is an in-depth analysis detailing your home's value as well as a comparison with similar homes in the area
Home Values in the Area
Average Home Value in this Area
Purchase History
| Date | Buyer | Sale Price | Title Company |
|---|---|---|---|
| Mcgovern Leo J | $208,000 | -- | |
| Boen James A | $71,000 | -- | |
| Mcgovern Leo J | $208,000 | -- | |
| Boen James A | $71,000 | -- |
Source: Public Records
Mortgage History
| Date | Status | Borrower | Loan Amount |
|---|---|---|---|
| Open | Mcgovern Leo J | $197,600 | |
| Closed | Boen James A | $197,600 |
Source: Public Records
Tax History Compared to Growth
Tax History
| Year | Tax Paid | Tax Assessment Tax Assessment Total Assessment is a certain percentage of the fair market value that is determined by local assessors to be the total taxable value of land and additions on the property. | Land | Improvement |
|---|---|---|---|---|
| 2025 | $43 | $325,800 | $185,600 | $140,200 |
| 2024 | $4,153 | $296,000 | $175,900 | $120,100 |
| 2023 | $4,032 | $296,000 | $175,900 | $120,100 |
| 2022 | $3,997 | $252,800 | $146,600 | $106,200 |
| 2021 | $3,781 | $225,300 | $133,000 | $92,300 |
| 2020 | $4,937 | $278,900 | $130,500 | $148,400 |
| 2019 | $4,699 | $261,200 | $130,500 | $130,700 |
| 2018 | $4,845 | $261,200 | $130,500 | $130,700 |
| 2017 | $4,030 | $233,200 | $130,500 | $102,700 |
| 2016 | $4,026 | $235,300 | $130,500 | $104,800 |
| 2015 | $3,446 | $210,500 | $118,600 | $91,900 |
Source: Public Records
Map
Nearby Homes