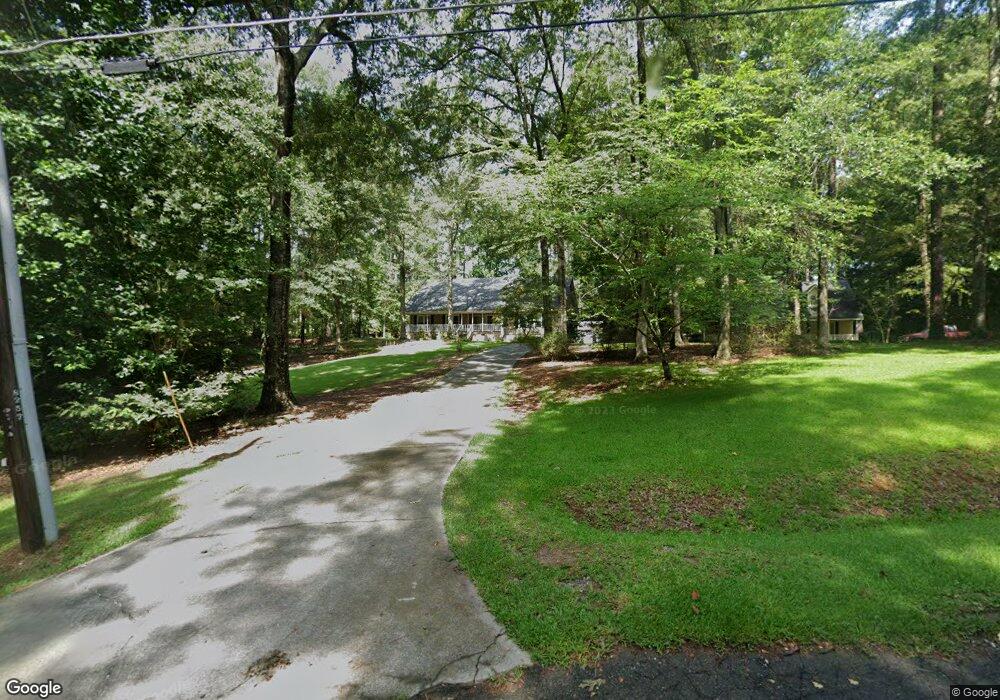
106 W Lakeview Dr NE Unit 3A Milledgeville, GA 31061
Estimated Value: $442,806 - $555,000
--
Bed
3
Baths
2,843
Sq Ft
$181/Sq Ft
Est. Value
About This Home
This home is located at 106 W Lakeview Dr NE Unit 3A, Milledgeville, GA 31061 and is currently estimated at $514,202, approximately $180 per square foot. 106 W Lakeview Dr NE Unit 3A is a home located in Baldwin County with nearby schools including Lakeview Primary, Lakeview Academy, and Oak Hill Middle School.
Ownership History
Date
Name
Owned For
Owner Type
Purchase Details
Closed on
Feb 8, 2019
Sold by
Hobbs William D
Bought by
Mcbrayer Blake A and Hobbs Elisabeth J
Current Estimated Value
Home Financials for this Owner
Home Financials are based on the most recent Mortgage that was taken out on this home.
Original Mortgage
$196,000
Outstanding Balance
$171,968
Interest Rate
4.4%
Mortgage Type
New Conventional
Estimated Equity
$342,234
Purchase Details
Closed on
Oct 28, 2009
Sold by
Hobbs William D
Bought by
Hobbs William D and Hobbs Elisabeth A
Home Financials for this Owner
Home Financials are based on the most recent Mortgage that was taken out on this home.
Original Mortgage
$140,650
Interest Rate
4.93%
Mortgage Type
New Conventional
Purchase Details
Closed on
May 11, 2009
Sold by
Masse David Allen
Bought by
Prudential Relocation Inc
Purchase Details
Closed on
Oct 1, 2003
Sold by
Masse David
Bought by
Masse David A and Lynn Meg
Create a Home Valuation Report for This Property
The Home Valuation Report is an in-depth analysis detailing your home's value as well as a comparison with similar homes in the area
Home Values in the Area
Average Home Value in this Area
Purchase History
| Date | Buyer | Sale Price | Title Company |
|---|---|---|---|
| Mcbrayer Blake A | $245,000 | -- | |
| Hobbs William D | -- | -- | |
| Hobbs William D | $145,000 | -- | |
| Prudential Relocation Inc | $225,000 | -- | |
| Masse David A | -- | -- |
Source: Public Records
Mortgage History
| Date | Status | Borrower | Loan Amount |
|---|---|---|---|
| Open | Mcbrayer Blake A | $196,000 | |
| Previous Owner | Hobbs William D | $140,650 |
Source: Public Records
Tax History Compared to Growth
Tax History
| Year | Tax Paid | Tax Assessment Tax Assessment Total Assessment is a certain percentage of the fair market value that is determined by local assessors to be the total taxable value of land and additions on the property. | Land | Improvement |
|---|---|---|---|---|
| 2025 | $3,054 | $125,312 | $14,400 | $110,912 |
| 2024 | $3,054 | $125,312 | $14,400 | $110,912 |
| 2023 | $2,388 | $98,004 | $12,000 | $86,004 |
| 2022 | $2,214 | $99,820 | $12,000 | $87,820 |
| 2021 | $1,657 | $73,280 | $12,000 | $61,280 |
| 2020 | $1,634 | $73,280 | $12,000 | $61,280 |
| 2019 | $1,637 | $73,280 | $12,000 | $61,280 |
| 2018 | $1,646 | $73,280 | $12,000 | $61,280 |
| 2017 | $1,377 | $75,280 | $14,000 | $61,280 |
| 2016 | $1,480 | $65,000 | $12,000 | $53,000 |
| 2015 | $1,483 | $65,000 | $12,000 | $53,000 |
| 2014 | $1,486 | $65,000 | $12,000 | $53,000 |
Source: Public Records
Map
Nearby Homes
- 191 E Lakeview Dr
- 191A E Lakeview Dr NE Unit B
- 185 E Lakeview Dr NE
- 410 High Bluff Ct NE
- 514 High Bluff Ct NE
- 116 Newport Rd NE
- 205 Lakecrest Dr NE
- 211 Lakecrest Dr NE
- 123 S Emerald Way
- 236 Erin Shores Dr NE
- 236 Erin Shores Dr
- 113 Island View Dr NE
- 103 Water Ridge Dr
- 307 W Lakeview Dr NE
- 745 Chickasaw Trail S
- 210 Erin Shores Dr
- 111 Miller Ct
- 109 Miller Ct
- 105 Miller Ct
- 106 W Lakeview Dr NE
- 108 W Lakeview Dr NE
- 109 Grace Ct NE
- 110 W Lakeview Dr NE
- 111 Grace Ct NE
- 113 Grace Ct NE
- 107 Grace Ct NE
- 112 W Lakeview Dr NE
- 109 W Lakeview Dr NE
- 111 W Lakeview Dr NE
- 114 Grace Ct NE
- 130 W Lakeview Dr NE
- 134 W Lakeview Dr NE
- 105 Grace Ct NE Unit 8
- 105 Grace Ct NE
- 193 E Lakeview Dr NE
- 113 W Lakeview Dr NE
- 192 E Lakeview Dr NE
- 114 W Lakeview Dr NE
- 202 Lakeport Rd