Estimated Value: $131,991 - $174,000
--
Bed
2
Baths
1,395
Sq Ft
$113/Sq Ft
Est. Value
About This Home
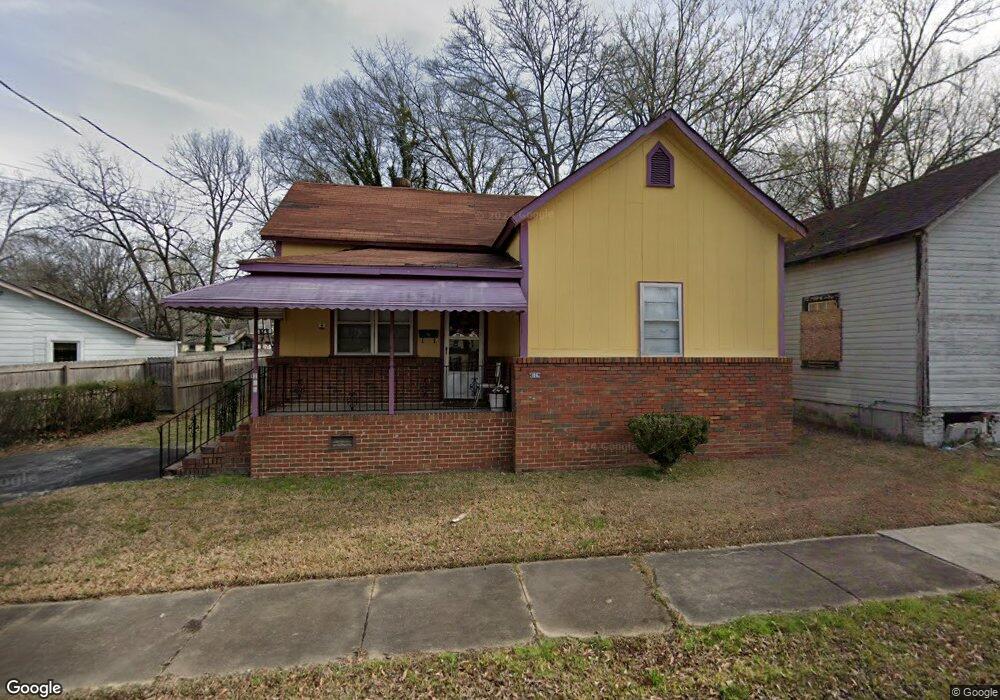
This home is located at 106 W Main St SW, Rome, GA 30161 and is currently estimated at $157,998, approximately $113 per square foot. 106 W Main St SW is a home located in Floyd County with nearby schools including Dan McCarty Middle School, Rome High School, and Darlington School.
Ownership History
Date
Name
Owned For
Owner Type
Purchase Details
Closed on
Jun 2, 2025
Sold by
Oglesby Rena E
Bought by
Fkpc Properties Llc
Current Estimated Value
Purchase Details
Closed on
Oct 25, 2017
Sold by
Johnson Cora Lee
Bought by
Oglesby Rena Elizabeth and Oglesby Andrew Robert
Purchase Details
Closed on
Feb 25, 2005
Sold by
Johnson Lloyd
Bought by
Johnson Cora Lee
Purchase Details
Closed on
Feb 11, 1991
Bought by
P and R
Purchase Details
Closed on
Nov 1, 1990
Sold by
Johnson Loyd
Bought by
Johnson Cora Lee
Purchase Details
Closed on
Jan 13, 1972
Sold by
Cooprer John S
Bought by
Johnson Loyd
Purchase Details
Closed on
Jan 11, 1972
Sold by
First National Bank & Isobel B King
Bought by
Cooprer John S
Purchase Details
Closed on
Jul 28, 1971
Sold by
Duffur Investment Co Inc
Bought by
First National Bank & Isobel B King
Purchase Details
Closed on
May 28, 1965
Sold by
Howell Sammie J 1St Natl Bank
Bought by
Duffur Investment Co Inc
Purchase Details
Closed on
Jan 1, 1901
Bought by
Howell Sammie J 1St Natl Bank
Create a Home Valuation Report for This Property
The Home Valuation Report is an in-depth analysis detailing your home's value as well as a comparison with similar homes in the area
Home Values in the Area
Average Home Value in this Area
Purchase History
| Date | Buyer | Sale Price | Title Company |
|---|---|---|---|
| Fkpc Properties Llc | $1,045 | -- | |
| Oglesby Rena Elizabeth | -- | -- | |
| Johnson Cora Lee | -- | -- | |
| P | -- | -- | |
| Johnson Cora Lee | -- | -- | |
| Johnson Loyd | $4,000 | -- | |
| Cooprer John S | -- | -- | |
| First National Bank & Isobel B King | -- | -- | |
| Duffur Investment Co Inc | -- | -- | |
| Howell Sammie J 1St Natl Bank | -- | -- |
Source: Public Records
Tax History Compared to Growth
Tax History
| Year | Tax Paid | Tax Assessment Tax Assessment Total Assessment is a certain percentage of the fair market value that is determined by local assessors to be the total taxable value of land and additions on the property. | Land | Improvement |
|---|---|---|---|---|
| 2024 | $940 | $46,286 | $3,309 | $42,977 |
| 2023 | $1,549 | $44,102 | $3,008 | $41,094 |
| 2022 | $1,031 | $28,260 | $2,406 | $25,854 |
| 2021 | $934 | $25,176 | $2,406 | $22,770 |
| 2020 | $871 | $23,271 | $1,880 | $21,391 |
| 2019 | $810 | $21,871 | $1,880 | $19,991 |
| 2018 | $759 | $20,492 | $1,880 | $18,612 |
| 2017 | $335 | $19,656 | $1,880 | $17,776 |
| 2016 | $334 | $19,082 | $1,880 | $17,202 |
| 2015 | -- | $19,082 | $1,880 | $17,202 |
| 2014 | -- | $19,082 | $1,880 | $17,202 |
Source: Public Records
Map
Nearby Homes
- 107 Butler St SW
- 515 Harper Ave SW
- 3 Grover St SW
- 18 Butler St SW
- 529 Branham Ave SW
- 111 Lookout Cir SW
- 515 S Broad St SW
- 113 Lookout Cir SW
- 3 Porter St SW
- 115 Lookout Cir SW
- 410 Hardy Ave SW
- 110 Cherokee St SW
- 235 Pennington Ave SW
- 334 Branham Ave SW
- 232 S Broad St SW
- 105 Mary St SW
- 5 Jervis St SW
- 13 N Blanche Ave SW
- 511 Pennington Ave SW
- 104 W Main St SW
- 509 Pennington Ave SW
- 514 Harper Ave SW
- 512 Harper Ave SW
- 503 Pennington Ave SW
- 503 Pennington Ave SW
- 516 Harper Ave SW
- 510 Harper Ave SW
- 518 Harper Ave SW
- 518 Harper Ave SE
- 508 Harper Ave SW
- 602 Pennington Ave SW
- 103 Butler St SW
- 600 Pennington Ave SW
- 504 Pennington Ave SW
- 101 Butler St SW
- 608 Pennington Ave SW
- 502 Pennington Ave SW
- 15 W Main St SW