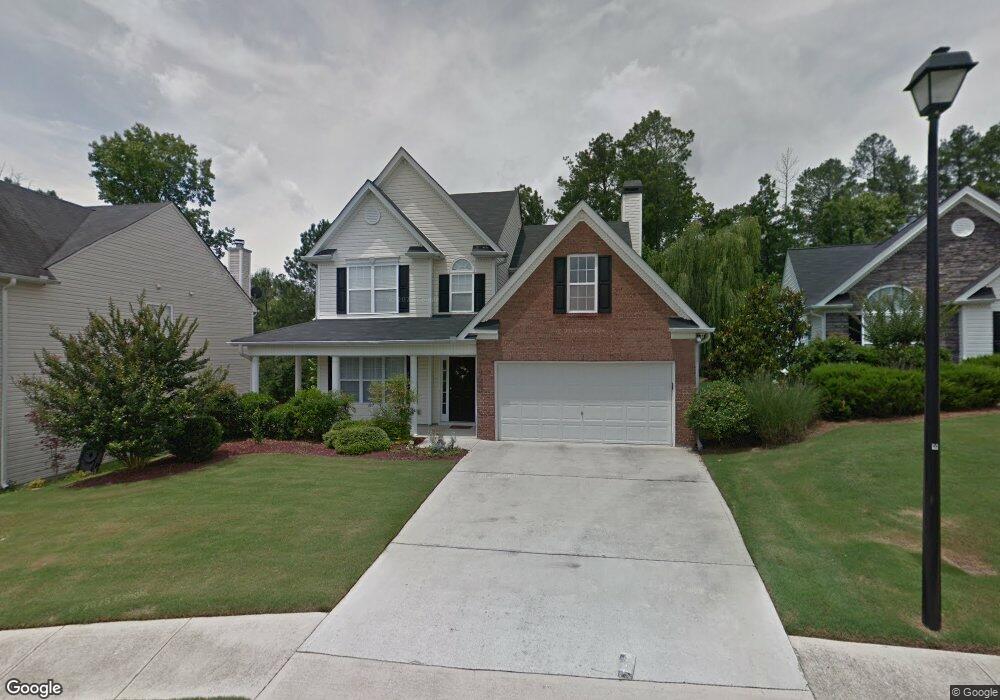
106 W Skyline View Dallas, GA 30157
Estimated Value: $311,092 - $349,000
3
Beds
3
Baths
2,134
Sq Ft
$155/Sq Ft
Est. Value
About This Home
This home is located at 106 W Skyline View, Dallas, GA 30157 and is currently estimated at $331,773, approximately $155 per square foot. 106 W Skyline View is a home located in Paulding County with nearby schools including Lillian C. Poole Elementary School, Herschel Jones Middle School, and Paulding County High School.
Ownership History
Date
Name
Owned For
Owner Type
Purchase Details
Closed on
Sep 22, 2015
Sold by
American Homes 4 Rent Properties Eight L
Bought by
Amh 2015 2 Borrower Llc
Current Estimated Value
Purchase Details
Closed on
Dec 17, 2014
Sold by
National Residential Nominee S
Bought by
American Homes 4 Rent Properti
Purchase Details
Closed on
Dec 4, 2014
Sold by
Barnett Constance E
Bought by
National Residential Nominee S
Purchase Details
Closed on
Mar 26, 2003
Sold by
P C Communities Llc
Bought by
Barnett Constance E
Home Financials for this Owner
Home Financials are based on the most recent Mortgage that was taken out on this home.
Original Mortgage
$148,500
Interest Rate
5.74%
Mortgage Type
FHA
Create a Home Valuation Report for This Property
The Home Valuation Report is an in-depth analysis detailing your home's value as well as a comparison with similar homes in the area
Home Values in the Area
Average Home Value in this Area
Purchase History
| Date | Buyer | Sale Price | Title Company |
|---|---|---|---|
| Amh 2015 2 Borrower Llc | -- | -- | |
| American Homes 4 Rent Properti | $145,000 | -- | |
| National Residential Nominee S | $145,750 | -- | |
| Barnett Constance E | $150,600 | -- |
Source: Public Records
Mortgage History
| Date | Status | Borrower | Loan Amount |
|---|---|---|---|
| Previous Owner | Barnett Constance E | $148,500 |
Source: Public Records
Tax History Compared to Growth
Tax History
| Year | Tax Paid | Tax Assessment Tax Assessment Total Assessment is a certain percentage of the fair market value that is determined by local assessors to be the total taxable value of land and additions on the property. | Land | Improvement |
|---|---|---|---|---|
| 2024 | $3,726 | $119,396 | $12,000 | $107,396 |
| 2023 | $3,504 | $115,888 | $12,000 | $103,888 |
| 2022 | $2,601 | $99,756 | $12,000 | $87,756 |
| 2021 | $2,266 | $77,964 | $12,000 | $65,964 |
| 2020 | $2,062 | $60,868 | $12,000 | $48,868 |
| 2019 | $2,088 | $60,868 | $12,000 | $48,868 |
| 2018 | $1,834 | $60,868 | $12,000 | $48,868 |
| 2017 | $1,979 | $57,012 | $12,000 | $45,012 |
| 2016 | $1,953 | $56,768 | $12,000 | $44,768 |
| 2015 | $1,622 | $52,696 | $12,000 | $40,696 |
| 2014 | $1,558 | $51,220 | $12,000 | $39,220 |
| 2013 | -- | $37,160 | $12,000 | $25,160 |
Source: Public Records
Map
Nearby Homes
- 112 W Skyline View
- 111 W Skyline View
- 204 Overlook Dr
- 209 Overlook Dr
- 103 E Skyline View
- 203 Overlook Ct
- The Coleman Plan at Oakmont
- The Harrington Plan at Oakmont
- The McGinnis Plan at Oakmont
- The Bradley Plan at Oakmont
- The Benson II Plan at Oakmont
- The James Plan at Oakmont
- The Caldwell Plan at Oakmont
- 403 Providence Rd
- 236 E Skyline View
- 552 S Fortune Way
- 233 E Skyline View
- 122 Arena Trail
- 100 S Fortune Way
- 106 W Skyline View Unit GA14021
- 106 W Skyline View Unit Ga1402
- 106 W Skyline View
- 106 West Skyline View
- 108 West Skyline View
- 108 W Skyline View
- 104 West Skyline View
- 110 West Skyline View
- 110 W Skyline View
- 102 W Skyline View
- 102 West Skyline View
- 107 W Skyline View
- 107 West Skyline View
- 101 W Skyline View
- 112 West Skyline View
- 101 West Skyline View
- 109 West Skyline View
- 114 West Skyline View
- 114 W Skyline View
- 111 West Skyline View