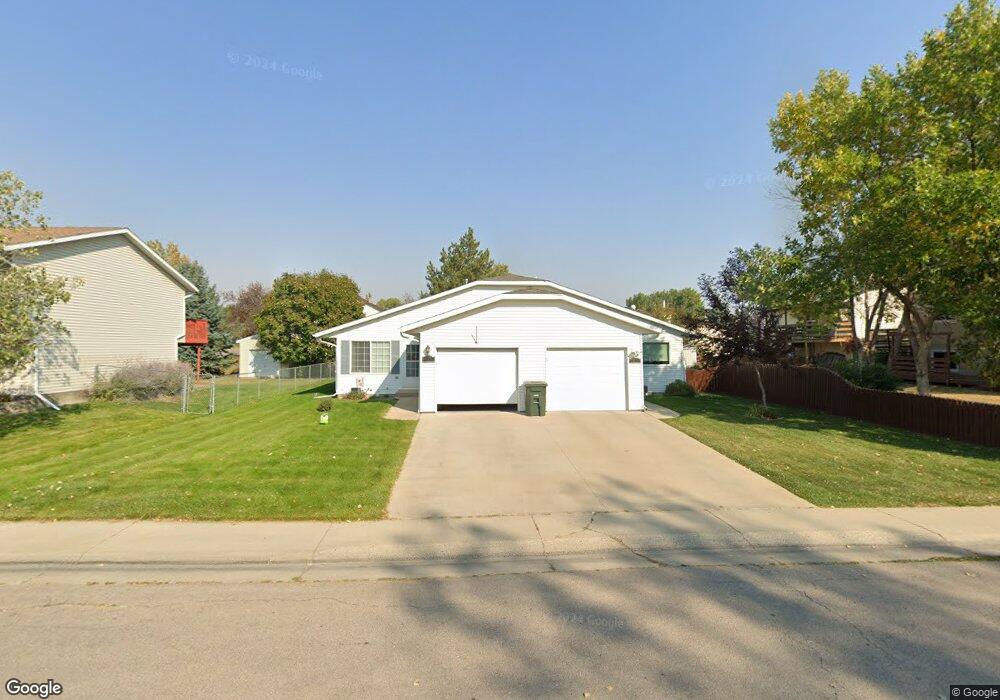
106 W Tonk St Gillette, WY 82718
Estimated Value: $216,000 - $255,424
3
Beds
2
Baths
1,196
Sq Ft
$199/Sq Ft
Est. Value
About This Home
This home is located at 106 W Tonk St, Gillette, WY 82718 and is currently estimated at $237,808, approximately $198 per square foot. 106 W Tonk St is a home located in Campbell County with nearby schools including Westwood High School, Sunflower Elementary School, and Sage Valley Junior High School.
Ownership History
Date
Name
Owned For
Owner Type
Purchase Details
Closed on
Jun 25, 2018
Sold by
Beckham Cory R and Beckham Jade
Bought by
Volk Margie C
Current Estimated Value
Home Financials for this Owner
Home Financials are based on the most recent Mortgage that was taken out on this home.
Original Mortgage
$124,200
Outstanding Balance
$107,876
Interest Rate
4.6%
Mortgage Type
New Conventional
Estimated Equity
$129,932
Purchase Details
Closed on
Aug 14, 2014
Sold by
Wells Fargo Bank Na
Bought by
Secretary Of Hud
Purchase Details
Closed on
Aug 11, 2014
Sold by
West Joshuva
Bought by
Wells Fargo Bank Na
Purchase Details
Closed on
Mar 9, 2010
Sold by
Degaugh Carolyn Sue
Bought by
West Joshua
Purchase Details
Closed on
Mar 29, 2005
Sold by
Cumpton Amber F
Bought by
Degaugh Carolyn Sue
Home Financials for this Owner
Home Financials are based on the most recent Mortgage that was taken out on this home.
Original Mortgage
$109,620
Interest Rate
5.67%
Mortgage Type
FHA
Create a Home Valuation Report for This Property
The Home Valuation Report is an in-depth analysis detailing your home's value as well as a comparison with similar homes in the area
Home Values in the Area
Average Home Value in this Area
Purchase History
| Date | Buyer | Sale Price | Title Company |
|---|---|---|---|
| Volk Margie C | -- | None Available | |
| Secretary Of Hud | -- | None Available | |
| Wells Fargo Bank Na | $89,700 | None Available | |
| West Joshua | -- | None Available | |
| Degaugh Carolyn Sue | -- | Stewart Title Company |
Source: Public Records
Mortgage History
| Date | Status | Borrower | Loan Amount |
|---|---|---|---|
| Open | Volk Margie C | $124,200 | |
| Previous Owner | Degaugh Carolyn Sue | $109,620 |
Source: Public Records
Tax History Compared to Growth
Tax History
| Year | Tax Paid | Tax Assessment Tax Assessment Total Assessment is a certain percentage of the fair market value that is determined by local assessors to be the total taxable value of land and additions on the property. | Land | Improvement |
|---|---|---|---|---|
| 2025 | $1,418 | $10,528 | $1,933 | $8,595 |
| 2024 | $1,418 | $20,160 | $3,717 | $16,443 |
| 2023 | $1,380 | $19,619 | $3,717 | $15,902 |
| 2022 | $1,093 | $15,487 | $2,767 | $12,720 |
| 2021 | $984 | $14,421 | $2,767 | $11,654 |
| 2020 | $908 | $13,345 | $2,529 | $10,816 |
| 2019 | $904 | $13,310 | $2,529 | $10,781 |
| 2018 | $811 | $11,996 | $2,529 | $9,467 |
| 2017 | $856 | $12,693 | $2,529 | $10,164 |
| 2016 | $948 | $14,040 | $2,494 | $11,546 |
| 2015 | -- | $14,136 | $2,494 | $11,642 |
| 2014 | -- | $13,754 | $2,494 | $11,260 |
Source: Public Records
Map
Nearby Homes
- 1801 S Gillette Ave
- 300 E Laurel St
- 204 W Juniper Ln
- 404 Laurel Ct
- 480 Boxelder Rd
- 2329/2331 Mahogany Cir
- 103 Sequoia Dr
- 100 W Hogeye Dr
- 2508 Cascade Dr
- 821 Madison St
- 2527 Rose Creek Dr
- 911 S Warren Ave
- 808 S Gillette Ave
- 410 Edwards St
- 706 S Gillette Ave
- 819 E 12th St
- 1207 Melissa Dr
- 3201 Watsabaugh Dr
- 1285 Country Club Rd
- 700 S Brooks Ave
- 108 W Tonk St
- 2000 S Gillette Ave
- 2002 S Gillette Ave
- 1910 S Gillette Ave
- 110 W Tonk St
- 1908 S Gillette Ave
- 1911 Linden Cir
- 1909 Linden Cir
- 1906 S Gillette Ave
- 2008 S Gillette Ave
- 2001 S Gillette Ave
- 1907 Linden Cir
- 114 W Tonk St
- 107 W Tonk St
- 2003 S Gillette Ave
- 1904 S Gillette Ave
- 1905 Linden Cir
- 111 W Tonk St
- 2010 S Gillette Ave
- 200 W Tonk St