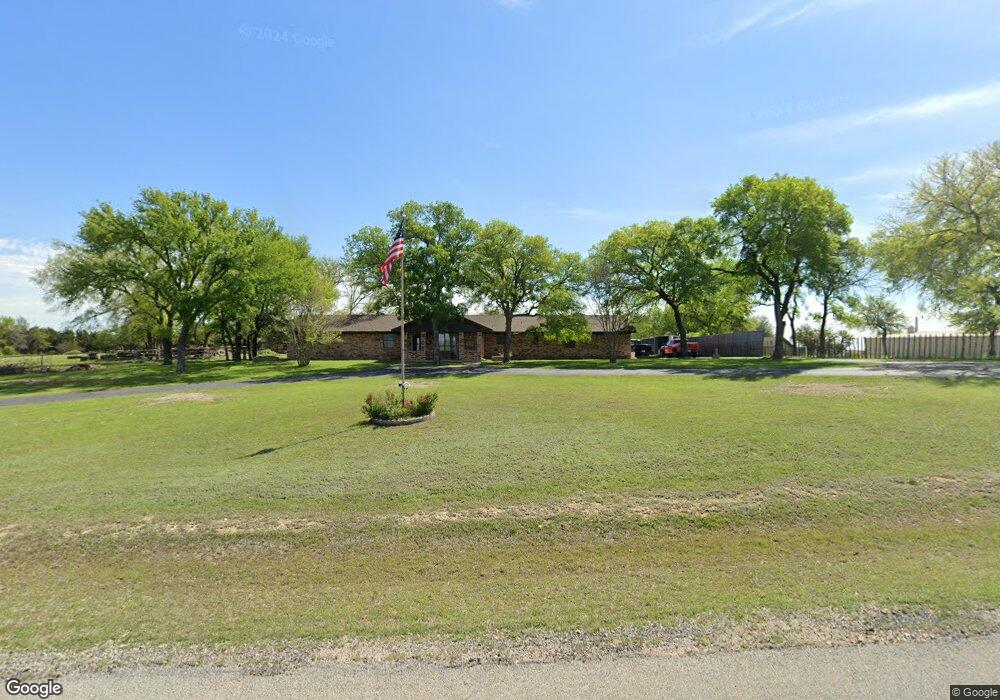
106 Woodcrest St Weatherford, TX 76087
Estimated Value: $510,000
3
Beds
3
Baths
2,277
Sq Ft
$224/Sq Ft
Est. Value
About This Home
This home is located at 106 Woodcrest St, Weatherford, TX 76087 and is currently estimated at $510,000, approximately $223 per square foot. 106 Woodcrest St is a home located in Parker County with nearby schools including Martin Elementary School, Tison Middle School, and Weatherford High School.
Ownership History
Date
Name
Owned For
Owner Type
Purchase Details
Closed on
Jul 19, 2012
Sold by
Winkle Tena G and Pitts Tena
Bought by
Miller Marissa Lee
Current Estimated Value
Home Financials for this Owner
Home Financials are based on the most recent Mortgage that was taken out on this home.
Original Mortgage
$244,963
Outstanding Balance
$169,494
Interest Rate
3.72%
Mortgage Type
New Conventional
Estimated Equity
$340,506
Purchase Details
Closed on
May 2, 2005
Sold by
French Jack C
Bought by
Miller Marissa Lee
Home Financials for this Owner
Home Financials are based on the most recent Mortgage that was taken out on this home.
Original Mortgage
$206,000
Interest Rate
6.06%
Purchase Details
Closed on
Nov 23, 1993
Bought by
Miller Marissa Lee
Purchase Details
Closed on
Nov 22, 1993
Bought by
Miller Marissa Lee
Create a Home Valuation Report for This Property
The Home Valuation Report is an in-depth analysis detailing your home's value as well as a comparison with similar homes in the area
Home Values in the Area
Average Home Value in this Area
Purchase History
| Date | Buyer | Sale Price | Title Company |
|---|---|---|---|
| Miller Marissa Lee | -- | Fatco | |
| Miller Marissa Lee | -- | -- | |
| Winle Tena O | -- | None Available | |
| Miller Marissa Lee | -- | -- | |
| Miller Marissa Lee | -- | -- |
Source: Public Records
Mortgage History
| Date | Status | Borrower | Loan Amount |
|---|---|---|---|
| Open | Miller Marissa Lee | $244,963 | |
| Previous Owner | Winle Tena O | $206,000 | |
| Previous Owner | Miller Marissa Lee | $200,000 |
Source: Public Records
Tax History Compared to Growth
Tax History
| Year | Tax Paid | Tax Assessment Tax Assessment Total Assessment is a certain percentage of the fair market value that is determined by local assessors to be the total taxable value of land and additions on the property. | Land | Improvement |
|---|---|---|---|---|
| 2025 | $2,423 | $210,576 | -- | -- |
| 2024 | $2,423 | $191,433 | -- | -- |
| 2023 | $2,423 | $174,030 | $0 | $0 |
| 2022 | $3,509 | $158,210 | $39,330 | $118,880 |
| 2021 | $3,799 | $158,210 | $39,330 | $118,880 |
| 2020 | $4,433 | $183,480 | $28,830 | $154,650 |
| 2019 | $4,217 | $183,480 | $28,830 | $154,650 |
| 2018 | $3,851 | $150,120 | $23,610 | $126,510 |
| 2017 | $3,950 | $150,120 | $23,610 | $126,510 |
| 2016 | $3,753 | $142,650 | $18,230 | $124,420 |
| 2015 | $3,069 | $142,650 | $18,230 | $124,420 |
| 2014 | $2,837 | $121,310 | $14,580 | $106,730 |
Source: Public Records
Map
Nearby Homes
- 2321 Shamrock Ln
- 2217 Lorrie Ln
- 2317 Shamrock Ln
- 532 Mitchell Blvd
- 536 Mitchell Blvd
- 2300 Shamrock Ln
- 541 Mitchell Blvd
- 516 Waterford Park Blvd
- 520 Waterford Park Blvd
- 513 Waterford Park Blvd
- 517 Waterford Park Blvd
- 2122 Louis Tr
- 521 Waterford Park Blvd
- 1525 Sand Dollar Trail
- 1520 Sidewinder Trail
- 540 Waterford Park Blvd
- 540 Waterford Park
- 541 Waterford Park Blvd
- 1529 Sidewinder Trail
- 544 Waterford Park Blvd
- 104 Woodcrest St
- 105 Woodcrest St
- 107 Woodcrest St
- 103 Woodcrest St
- 326 Billo Ct
- 413 Meadowview Rd
- 322 Billo Ct
- 331 Billo Ct
- 109 Woodcrest St
- 318 Billo Ct
- 329 Billo Ct
- 310 Billo Ct
- 116 Woodcrest St
- 314 Billo Ct
- 111 Woodcrest St
- 306 Billo Ct
- 411 Meadowview Rd
- 115 Woodcrest St
- 325 Billo Ct
- 302 Billo Ct