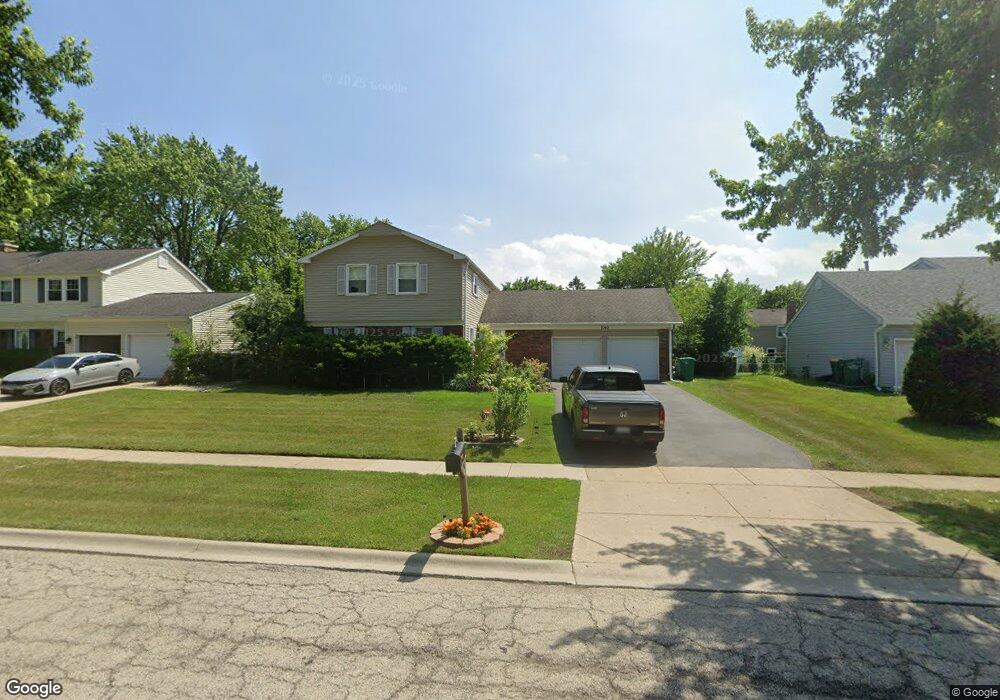
1060 Belmar Ln Buffalo Grove, IL 60089
Estimated Value: $509,000 - $561,000
4
Beds
3
Baths
2,115
Sq Ft
$253/Sq Ft
Est. Value
About This Home
This home is located at 1060 Belmar Ln, Buffalo Grove, IL 60089 and is currently estimated at $534,680, approximately $252 per square foot. 1060 Belmar Ln is a home located in Lake County with nearby schools including Ivy Hall Elementary School, Twin Groves Middle School, and Adlai E Stevenson High School.
Ownership History
Date
Name
Owned For
Owner Type
Purchase Details
Closed on
Sep 16, 2005
Sold by
Ioffe Alexander and Ioffe Helen
Bought by
Gutin Leo and Gutin Anna
Current Estimated Value
Home Financials for this Owner
Home Financials are based on the most recent Mortgage that was taken out on this home.
Original Mortgage
$350,000
Interest Rate
6.34%
Mortgage Type
Fannie Mae Freddie Mac
Purchase Details
Closed on
Dec 3, 1993
Sold by
Feygin Meyer and Feygina Khana
Bought by
Ioffe Alexander and Ioffe Yelena
Create a Home Valuation Report for This Property
The Home Valuation Report is an in-depth analysis detailing your home's value as well as a comparison with similar homes in the area
Home Values in the Area
Average Home Value in this Area
Purchase History
| Date | Buyer | Sale Price | Title Company |
|---|---|---|---|
| Gutin Leo | $382,000 | Multiple | |
| Ioffe Alexander | -- | -- |
Source: Public Records
Mortgage History
| Date | Status | Borrower | Loan Amount |
|---|---|---|---|
| Previous Owner | Gutin Leo | $350,000 |
Source: Public Records
Tax History Compared to Growth
Tax History
| Year | Tax Paid | Tax Assessment Tax Assessment Total Assessment is a certain percentage of the fair market value that is determined by local assessors to be the total taxable value of land and additions on the property. | Land | Improvement |
|---|---|---|---|---|
| 2024 | $13,074 | $143,559 | $35,943 | $107,616 |
| 2023 | $12,283 | $135,459 | $33,915 | $101,544 |
| 2022 | $12,283 | $123,792 | $30,994 | $92,798 |
| 2021 | $11,817 | $122,457 | $30,660 | $91,797 |
| 2020 | $11,538 | $122,875 | $30,765 | $92,110 |
| 2019 | $11,380 | $122,422 | $30,652 | $91,770 |
| 2018 | $10,189 | $113,578 | $30,293 | $83,285 |
| 2017 | $10,070 | $110,927 | $29,586 | $81,341 |
| 2016 | $9,731 | $106,221 | $28,331 | $77,890 |
| 2015 | $9,468 | $99,337 | $26,495 | $72,842 |
| 2014 | $8,966 | $93,116 | $28,456 | $64,660 |
| 2012 | $8,927 | $95,688 | $28,513 | $67,175 |
Source: Public Records
Map
Nearby Homes
- 1032 Courtland Dr Unit 9
- 12 Cloverdale Ct
- 950 Belmar Ln
- 1141 Devonshire Rd
- 1325 Fairfax Ln
- 1324 Fairfax Ln Unit B32
- 5107 N Arlington Heights Rd
- 931 Shady Grove Ln
- 1265 Devonshire Rd
- 800 Clohesey Dr
- 887 Saybrook Ln Unit 2
- 890 Knollwood Dr
- 1357 Bristol Ln Unit Q4
- 327 Lasalle Ln
- 610 Checker Dr
- 1514 Sumter Dr
- 711 Woodhollow Ln
- 1118 Larraway Dr
- 1546 Brandywyn Ln
- 614 Lyon Ct
- 1070 Belmar Ln
- 1050 Belmar Ln
- 1093 Alden Ln
- 1081 Alden Ln
- 1105 Alden Ln
- 1040 Belmar Ln
- 1080 Belmar Ln
- 1069 Alden Ln
- 1051 Belmar Ln
- 1061 Belmar Ln
- 1041 Belmar Ln
- 1071 Belmar Ln
- 1129 Alden Ln
- 1129 Alden Ln Unit 1
- 1030 Belmar Ln Unit 11
- 1057 Alden Ln
- 1031 Belmar Ln
- 1081 Belmar Ln
- 1092 Alden Ln
- 1104 Alden Ln