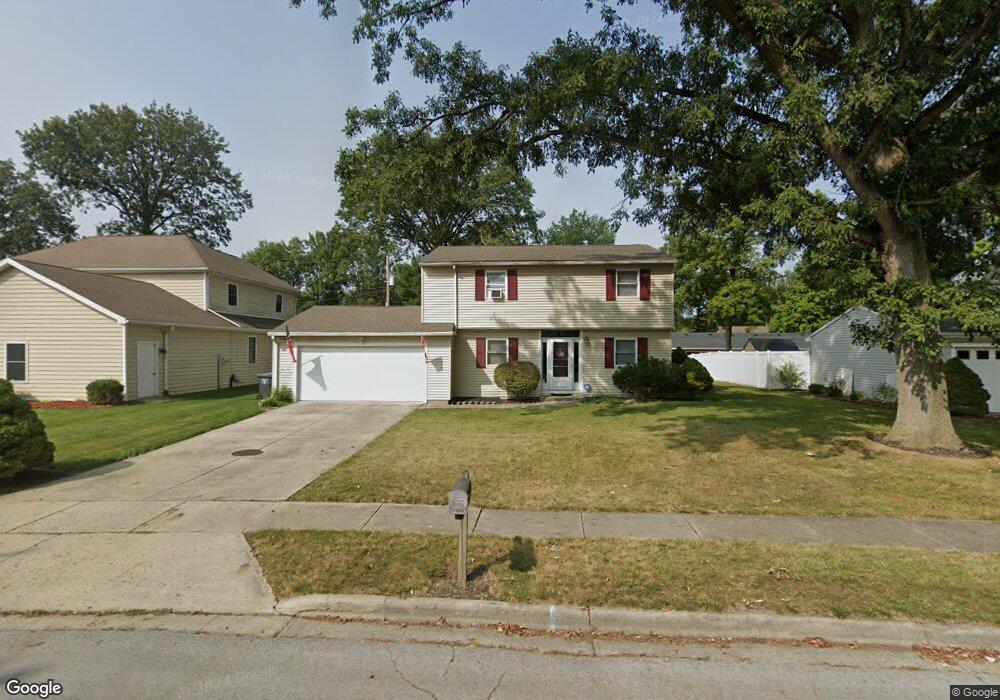
1060 Cameron Ln Lima, OH 45805
Lakewood West NeighborhoodEstimated Value: $215,000 - $239,031
3
Beds
3
Baths
1,648
Sq Ft
$140/Sq Ft
Est. Value
About This Home
This home is located at 1060 Cameron Ln, Lima, OH 45805 and is currently estimated at $230,508, approximately $139 per square foot. 1060 Cameron Ln is a home located in Allen County with nearby schools including Maplewood Elementary School, Elmwood Elementary School, and Shawnee Middle School.
Ownership History
Date
Name
Owned For
Owner Type
Purchase Details
Closed on
Jan 17, 2008
Sold by
Household Realty Corp
Bought by
Pitson Jennifer M
Current Estimated Value
Home Financials for this Owner
Home Financials are based on the most recent Mortgage that was taken out on this home.
Original Mortgage
$86,500
Outstanding Balance
$53,856
Interest Rate
5.9%
Mortgage Type
Purchase Money Mortgage
Estimated Equity
$176,652
Purchase Details
Closed on
Oct 15, 2007
Sold by
Lewis Timothy
Bought by
Hsbc Mortgage Services Inc
Purchase Details
Closed on
Jul 1, 2002
Sold by
Lapielle Mark M
Bought by
Lewis Timothy and Lewis Jennifer
Purchase Details
Closed on
Aug 11, 2000
Sold by
Meeker Larry L
Bought by
Lapierre Mark M and Lapierre Jennifer L
Purchase Details
Closed on
Feb 24, 1997
Sold by
Debrosse Christopher
Bought by
Meeker Larry and Meeker Tamara
Purchase Details
Closed on
Dec 31, 1991
Bought by
Debrosse Christopher A
Create a Home Valuation Report for This Property
The Home Valuation Report is an in-depth analysis detailing your home's value as well as a comparison with similar homes in the area
Home Values in the Area
Average Home Value in this Area
Purchase History
| Date | Buyer | Sale Price | Title Company |
|---|---|---|---|
| Pitson Jennifer M | -- | Sovereign Title Agency Llc | |
| Hsbc Mortgage Services Inc | $76,000 | None Available | |
| Lewis Timothy | $110,000 | -- | |
| Lapierre Mark M | $97,500 | -- | |
| Meeker Larry | $97,964 | -- | |
| Debrosse Christopher A | $5,000 | -- |
Source: Public Records
Mortgage History
| Date | Status | Borrower | Loan Amount |
|---|---|---|---|
| Open | Pitson Jennifer M | $86,500 | |
| Closed | Lapierre Mark M | -- |
Source: Public Records
Tax History
| Year | Tax Paid | Tax Assessment Tax Assessment Total Assessment is a certain percentage of the fair market value that is determined by local assessors to be the total taxable value of land and additions on the property. | Land | Improvement |
|---|---|---|---|---|
| 2024 | $2,570 | $64,020 | $7,350 | $56,670 |
| 2023 | $2,127 | $47,780 | $5,500 | $42,280 |
| 2022 | $2,140 | $47,780 | $5,500 | $42,280 |
| 2021 | $2,152 | $47,780 | $5,500 | $42,280 |
| 2020 | $1,695 | $39,690 | $5,180 | $34,510 |
| 2019 | $1,695 | $39,690 | $5,180 | $34,510 |
| 2018 | $1,702 | $39,690 | $5,180 | $34,510 |
| 2017 | $1,724 | $39,690 | $5,180 | $34,510 |
| 2016 | $1,703 | $39,690 | $5,180 | $34,510 |
| 2015 | $1,699 | $39,690 | $5,180 | $34,510 |
| 2014 | $1,704 | $39,450 | $5,360 | $34,090 |
| 2013 | $1,669 | $39,450 | $5,360 | $34,090 |
Source: Public Records
Map
Nearby Homes
- 3071 Canterbury Dr
- 2997 Cletus Pkwy
- 2921 Canterbury Dr
- 2964 Hanover Dr
- 2949 Lakewood Ave
- 0 Springview Dr
- 250 Squire Ln
- 3360 Springview Dr
- 3390 Spencerville Rd
- 2802 Lowell Ave
- 1408 Winghaven Dr
- 2700 Lowell Ave
- 206 Eagles Point St E
- 123 Eagles Point W
- 1421 Shawnee Rd
- 1453 W Shore Dr
- XXXX Spencerville Rd
- 2072 Arcadia Ave
- 1880 Wendell Ave
- 145 N Concept Dr
- 1072 Cameron Ln
- 1052 Cameron Ln
- 1059 Esther Blvd
- 1069 Esther Blvd
- 1080 Cameron Ln
- 1044 Cameron Ln
- 1061 Cameron Ln
- 1053 Cameron Ln
- 1089 Esther Blvd
- 1043 Esther Blvd
- 1071 Cameron Ln
- 1045 Cameron Ln
- 1091 Cameron Ln
- 1090 Cameron Ln
- 1037 Cameron Ln
- 1035 Esther Blvd
- 1060 Esther Blvd
- 1052 Esther Blvd
- 1070 Esther Blvd
- 1044 Esther Blvd
Your Personal Tour Guide
Ask me questions while you tour the home.