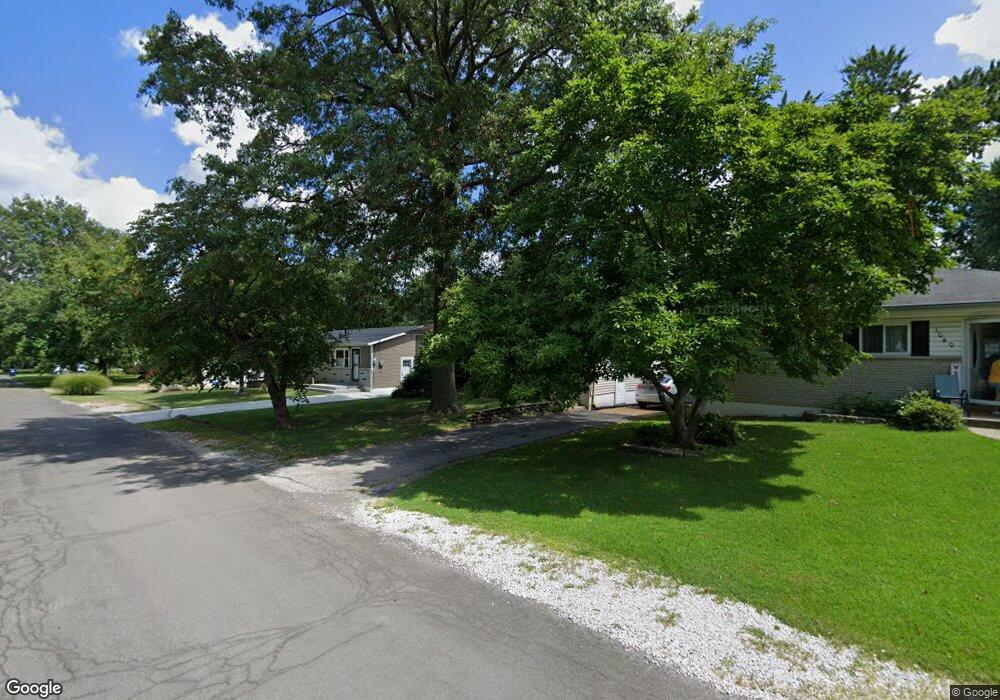
1060 Clark St Florissant, MO 63031
Estimated Value: $149,646 - $162,000
3
Beds
2
Baths
864
Sq Ft
$183/Sq Ft
Est. Value
About This Home
This home is located at 1060 Clark St, Florissant, MO 63031 and is currently estimated at $157,912, approximately $182 per square foot. 1060 Clark St is a home located in St. Louis County with nearby schools including Combs Elementary School, Cross Keys Middle School, and McCluer North High School.
Ownership History
Date
Name
Owned For
Owner Type
Purchase Details
Closed on
Mar 29, 2023
Sold by
Lilsean Llc
Bought by
Saa Executive Group 3 Llc
Current Estimated Value
Purchase Details
Closed on
Nov 13, 2009
Sold by
Mcfatridge Chris and Mcfatridge Maggie
Bought by
Lilsean Llc
Purchase Details
Closed on
Jul 16, 2004
Sold by
Mcfatridge Maggie and Mcfatridge Chris
Bought by
Mcfatridge Chris and Mcfatridge Maggie
Home Financials for this Owner
Home Financials are based on the most recent Mortgage that was taken out on this home.
Original Mortgage
$84,800
Interest Rate
6.5%
Mortgage Type
New Conventional
Purchase Details
Closed on
Feb 20, 2003
Sold by
Mccune Rodger L and Mccune Susan M
Bought by
Schmidt Margaret C
Home Financials for this Owner
Home Financials are based on the most recent Mortgage that was taken out on this home.
Original Mortgage
$91,698
Interest Rate
5.9%
Mortgage Type
VA
Create a Home Valuation Report for This Property
The Home Valuation Report is an in-depth analysis detailing your home's value as well as a comparison with similar homes in the area
Home Values in the Area
Average Home Value in this Area
Purchase History
| Date | Buyer | Sale Price | Title Company |
|---|---|---|---|
| Saa Executive Group 3 Llc | -- | -- | |
| Lilsean Llc | $55,000 | Integrity Land Title Co Inc | |
| Mcfatridge Chris | -- | Enterprise Land Title Co Inc | |
| Schmidt Margaret C | $89,900 | -- |
Source: Public Records
Mortgage History
| Date | Status | Borrower | Loan Amount |
|---|---|---|---|
| Previous Owner | Mcfatridge Chris | $84,800 | |
| Previous Owner | Schmidt Margaret C | $91,698 | |
| Closed | Mcfatridge Chris | $21,200 |
Source: Public Records
Tax History Compared to Growth
Tax History
| Year | Tax Paid | Tax Assessment Tax Assessment Total Assessment is a certain percentage of the fair market value that is determined by local assessors to be the total taxable value of land and additions on the property. | Land | Improvement |
|---|---|---|---|---|
| 2025 | $1,852 | $27,020 | $4,140 | $22,880 |
| 2024 | $1,852 | $23,790 | $2,870 | $20,920 |
| 2023 | $1,852 | $23,790 | $2,870 | $20,920 |
| 2022 | $1,597 | $18,050 | $4,140 | $13,910 |
| 2021 | $1,570 | $19,510 | $4,140 | $15,370 |
| 2020 | $1,442 | $15,620 | $3,670 | $11,950 |
| 2019 | $1,224 | $15,620 | $3,670 | $11,950 |
| 2018 | $1,477 | $14,590 | $2,070 | $12,520 |
| 2017 | $1,469 | $14,590 | $2,070 | $12,520 |
| 2016 | $1,684 | $16,340 | $3,970 | $12,370 |
| 2015 | $1,694 | $16,340 | $3,970 | $12,370 |
| 2014 | $1,454 | $14,450 | $3,520 | $10,930 |
Source: Public Records
Map
Nearby Homes
- 1148 Boone St
- 865 Boone St
- 1090 Saint Joseph St
- 1023 Saint Denis St
- 13 Saint Celeste Dr
- 43 Saint Celeste Dr
- 6 Redwood Dr
- 1205 Fox Run Dr
- 37 Marquette Dr
- 1130 Saint Francois St
- 1290 Saint Louis St
- 629 Aubuchon St
- 1980 Parker Rd
- 410 N Jefferson St
- 1365 Saint Jean St
- 849 Saint Ferdinand St
- 1200 Bluefield Dr
- 1580 Queens Dr
- 1545 Bluefield Dr
- 1415 Saint Jean St