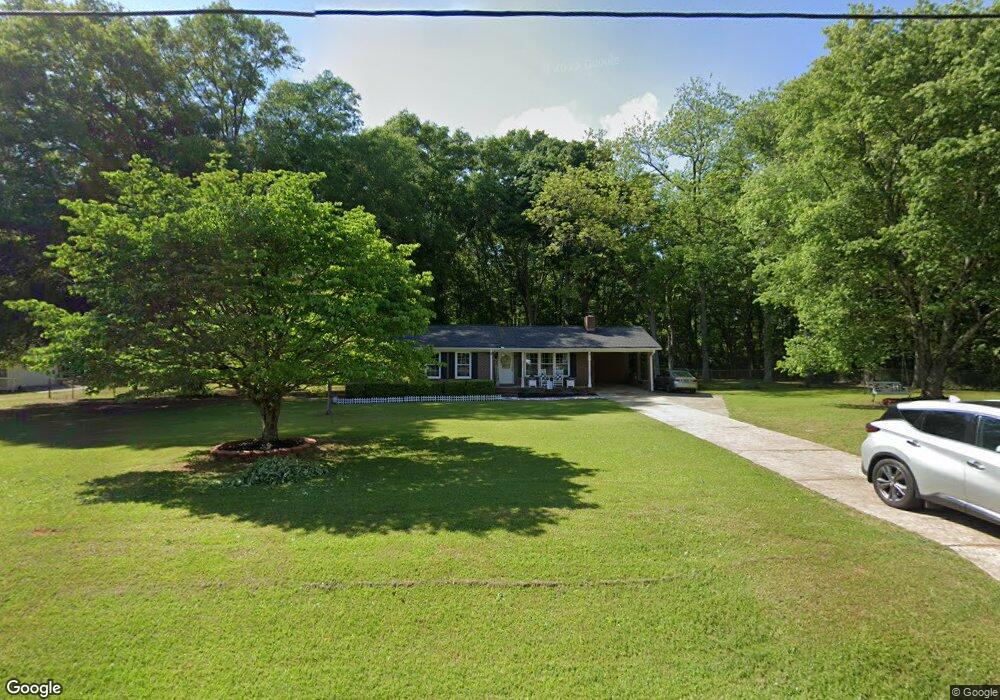
1060 Highway 362 W Williamson, GA 30292
Estimated Value: $226,000 - $285,000
3
Beds
2
Baths
1,319
Sq Ft
$188/Sq Ft
Est. Value
About This Home
This home is located at 1060 Highway 362 W, Williamson, GA 30292 and is currently estimated at $247,702, approximately $187 per square foot. 1060 Highway 362 W is a home located in Pike County with nearby schools including Pike County Primary School, Pike County Elementary School, and Pike County Middle School.
Ownership History
Date
Name
Owned For
Owner Type
Purchase Details
Closed on
Mar 1, 2022
Sold by
Harwell Lindsay N
Bought by
Martin Julie Lynn
Current Estimated Value
Home Financials for this Owner
Home Financials are based on the most recent Mortgage that was taken out on this home.
Original Mortgage
$180,500
Outstanding Balance
$168,202
Interest Rate
3.69%
Mortgage Type
Cash
Estimated Equity
$79,500
Purchase Details
Closed on
May 26, 2004
Sold by
Ridgeway Corbin and Ridgeway Heidi
Bought by
Hardwell Lindsay N
Purchase Details
Closed on
Jun 17, 1994
Sold by
Jones David H and Jones Glenn H
Bought by
Ridgeway Corbin and Ridgeway Heidi
Purchase Details
Closed on
Jan 14, 1994
Sold by
Jones Hazel B
Bought by
Jones David H and Jones Glenn H
Purchase Details
Closed on
Nov 30, 1977
Bought by
Jones Hazel B
Create a Home Valuation Report for This Property
The Home Valuation Report is an in-depth analysis detailing your home's value as well as a comparison with similar homes in the area
Home Values in the Area
Average Home Value in this Area
Purchase History
| Date | Buyer | Sale Price | Title Company |
|---|---|---|---|
| Martin Julie Lynn | $208,000 | -- | |
| Hardwell Lindsay N | $103,100 | -- | |
| Ridgeway Corbin | $68,000 | -- | |
| Jones David H | -- | -- | |
| Jones Hazel B | -- | -- |
Source: Public Records
Mortgage History
| Date | Status | Borrower | Loan Amount |
|---|---|---|---|
| Open | Martin Julie Lynn | $180,500 |
Source: Public Records
Tax History Compared to Growth
Tax History
| Year | Tax Paid | Tax Assessment Tax Assessment Total Assessment is a certain percentage of the fair market value that is determined by local assessors to be the total taxable value of land and additions on the property. | Land | Improvement |
|---|---|---|---|---|
| 2024 | $2,056 | $77,365 | $18,000 | $59,365 |
| 2023 | $2,514 | $77,365 | $18,000 | $59,365 |
| 2022 | $1,318 | $42,279 | $6,000 | $36,279 |
| 2021 | $1,359 | $42,279 | $6,000 | $36,279 |
| 2020 | $1,377 | $42,279 | $6,000 | $36,279 |
| 2019 | $1,253 | $33,966 | $6,000 | $27,966 |
| 2018 | $1,256 | $33,966 | $6,000 | $27,966 |
| 2017 | $1,248 | $33,966 | $6,000 | $27,966 |
| 2016 | $1,169 | $33,965 | $6,000 | $27,965 |
| 2015 | $1,120 | $33,965 | $6,000 | $27,965 |
| 2014 | $1,134 | $33,965 | $6,000 | $27,965 |
| 2013 | -- | $33,965 | $6,000 | $27,965 |
Source: Public Records
Map
Nearby Homes
- LOT 11 Georgia 362
- LOT 12 Georgia 362
- LOT 13 Georgia 362
- LOT 14 Georgia 362
- 124 Pine View Dr
- 190 Roundtree Way
- 0 Windsor Ct Unit LOT 25 10585833
- 74 Midland St
- 79 Huntington Way
- 108 Maple Ln
- 35 Huntington Way
- 0 Georgia 362 Unit 10581280
- 469 Ashley Glen Dr
- 1946 Highway 362 W
- 0 Wisteria Ln Unit 55 10592286
- 0 Wisteria Ln
- 318 Wisteria Ln Unit 42
- LOT 26 Conner Ln
- 488 Brown Station Dr
- 385 Brown Station Dr
- 1060 Georgia 362
- 1088 Highway 362 W
- 1010 Highway 362 W
- 85 Vaughn Ln
- 980 Highway 362 W
- 5603 Georgia 362
- 5603 Georgia 362
- 5603 Georgia 362
- 5188 Georgia 362
- 102 Drewery St
- 102 Drewery St
- 1166 Highway 362 W
- 962 Georgia 362
- 962 Highway 362 W
- 207 Old Fayetteville Rd
- 231 Old Fayetteville Rd
- 950 Highway 362 W
- 0 Williamson Trace Unit 8815606
- 948 Highway 362 W
- 42 Williamson Trace