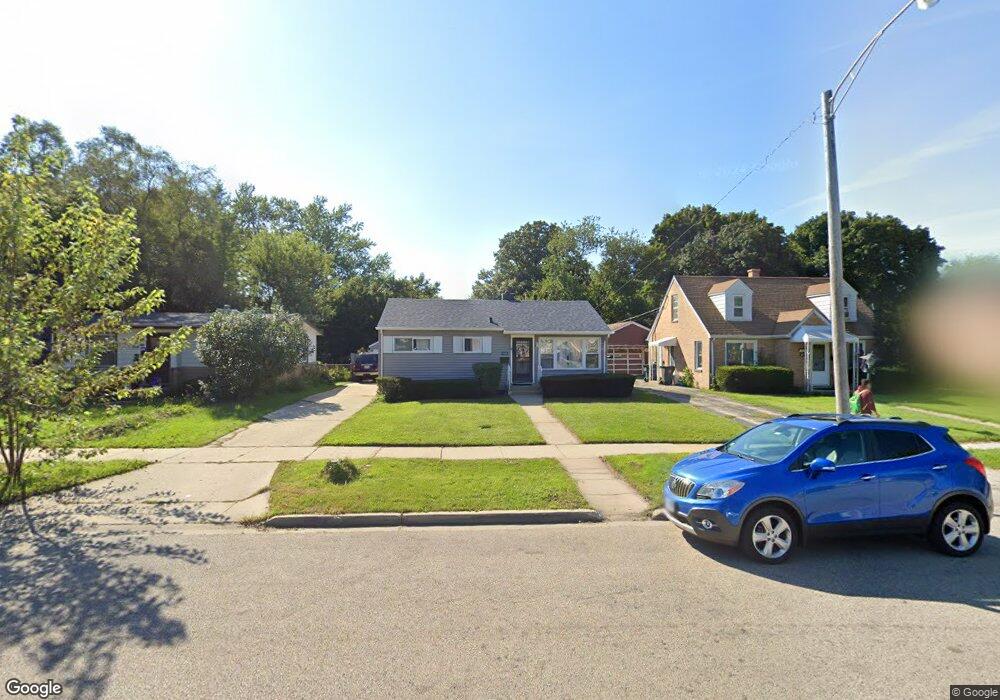
1060 N Berwick Blvd Waukegan, IL 60085
Glenwood Heights NeighborhoodEstimated Value: $218,000 - $256,000
3
Beds
1
Bath
1,096
Sq Ft
$215/Sq Ft
Est. Value
About This Home
This home is located at 1060 N Berwick Blvd, Waukegan, IL 60085 and is currently estimated at $235,209, approximately $214 per square foot. 1060 N Berwick Blvd is a home located in Lake County with nearby schools including Glenwood Elementary School, Miguel Juarez Middle School, and Waukegan High School.
Ownership History
Date
Name
Owned For
Owner Type
Purchase Details
Closed on
Sep 3, 2004
Sold by
Martinez Saul and Martinez Maritza
Bought by
Estrada Elid
Current Estimated Value
Home Financials for this Owner
Home Financials are based on the most recent Mortgage that was taken out on this home.
Original Mortgage
$161,537
Outstanding Balance
$80,083
Interest Rate
5.89%
Mortgage Type
FHA
Estimated Equity
$155,126
Purchase Details
Closed on
Jun 25, 1998
Sold by
Martinez Angel R and Martinez Elsie
Bought by
Martinez Saul and Martinez Maritza
Home Financials for this Owner
Home Financials are based on the most recent Mortgage that was taken out on this home.
Original Mortgage
$92,150
Interest Rate
7.5%
Purchase Details
Closed on
Sep 16, 1993
Sold by
Raidt Frank E and Raidt Patricia M
Bought by
Martinez Angel R and Martinez Elsie
Home Financials for this Owner
Home Financials are based on the most recent Mortgage that was taken out on this home.
Original Mortgage
$90,112
Interest Rate
7.24%
Mortgage Type
Assumption
Create a Home Valuation Report for This Property
The Home Valuation Report is an in-depth analysis detailing your home's value as well as a comparison with similar homes in the area
Home Values in the Area
Average Home Value in this Area
Purchase History
| Date | Buyer | Sale Price | Title Company |
|---|---|---|---|
| Estrada Elid | $164,500 | Ticor | |
| Martinez Saul | $97,000 | Stewart Title | |
| Martinez Angel R | $59,333 | -- |
Source: Public Records
Mortgage History
| Date | Status | Borrower | Loan Amount |
|---|---|---|---|
| Open | Estrada Elid | $161,537 | |
| Previous Owner | Martinez Saul | $92,150 | |
| Previous Owner | Martinez Angel R | $90,112 | |
| Closed | Martinez Saul | $3,000 |
Source: Public Records
Tax History Compared to Growth
Tax History
| Year | Tax Paid | Tax Assessment Tax Assessment Total Assessment is a certain percentage of the fair market value that is determined by local assessors to be the total taxable value of land and additions on the property. | Land | Improvement |
|---|---|---|---|---|
| 2024 | $4,495 | $62,179 | $11,236 | $50,943 |
| 2023 | $4,454 | $55,669 | $10,060 | $45,609 |
| 2022 | $4,454 | $51,561 | $8,925 | $42,636 |
| 2021 | $3,831 | $42,747 | $7,841 | $34,906 |
| 2020 | $3,834 | $39,824 | $7,305 | $32,519 |
| 2019 | $3,806 | $36,492 | $6,694 | $29,798 |
| 2018 | $3,538 | $33,748 | $8,528 | $25,220 |
| 2017 | $3,394 | $29,858 | $7,545 | $22,313 |
| 2016 | $3,082 | $25,945 | $6,556 | $19,389 |
| 2015 | $2,909 | $23,221 | $5,868 | $17,353 |
| 2014 | $2,884 | $22,586 | $5,431 | $17,155 |
| 2012 | $3,795 | $24,470 | $5,884 | $18,586 |
Source: Public Records
Map
Nearby Homes
- 1019 N Lewis Ave
- 1005 N Lewis Ave
- 12352 W Atlantic Ave
- 1023 N Elmwood Ave
- 1038 Indiana Ave
- 2009 Harding Ave
- 2008 Harding Ave
- 1213 Grand Ave
- 968 Judge Ave
- 1117 Judge Ave
- 2813 Theresa Ave
- 615 Tiffany Dr
- 2207 Williamsburg Dr
- 1504 W Glen Flora Ave
- 2115 Lydia St
- 2810 W Atlantic Ave
- 824 N Butrick St
- 1000 Pine St
- 2440 W Cheyenne Rd
- 1105 Woodlawn Cir
- 1062 N Berwick Blvd
- 1056 N Berwick Blvd
- 1064 N Berwick Blvd
- 1052 N Berwick Blvd
- 1102 N Berwick Blvd
- 1059 Glenwood Ave
- 1048 N Berwick Blvd
- 1055 Glenwood Ave
- 1101 Glenwood Ave
- 1108 N Berwick Blvd
- 1103 Glenwood Ave
- 1047 Glenwood Ave
- 1057 N Berwick Blvd
- 1044 N Berwick Blvd
- 1043 N Berwick Blvd
- 1061 N Berwick Blvd
- 1039 N Berwick Blvd
- 1107 Glenwood Ave
- 1043 Glenwood Ave
- 1110 N Berwick Blvd