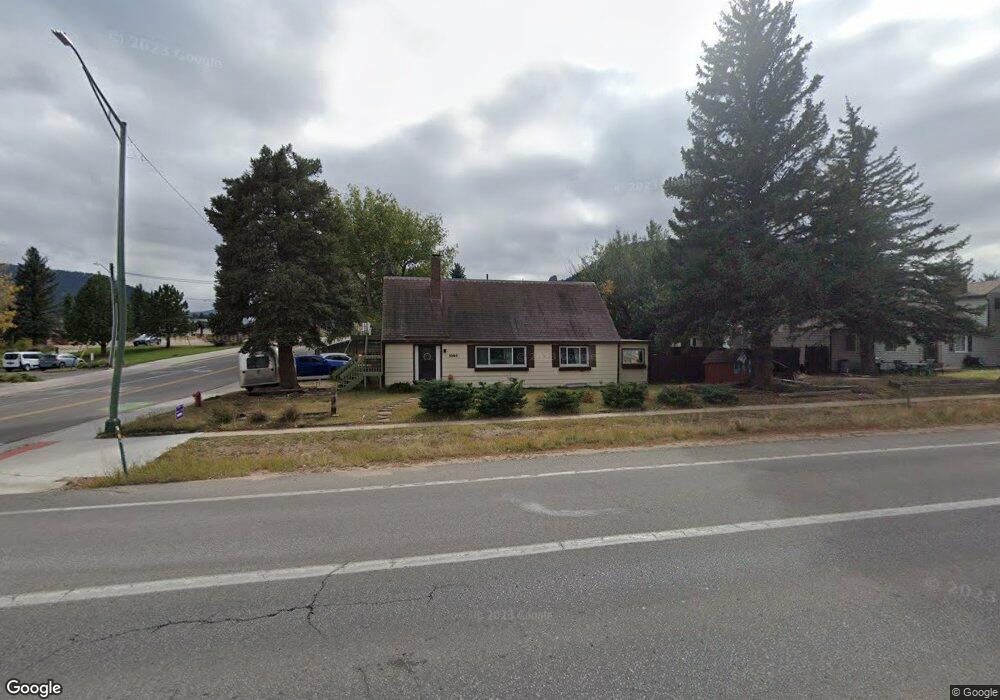
1060 N Saint Vrain Ave Estes Park, CO 80517
Estimated Value: $645,000 - $695,000
4
Beds
4
Baths
2,716
Sq Ft
$245/Sq Ft
Est. Value
About This Home
This home is located at 1060 N Saint Vrain Ave, Estes Park, CO 80517 and is currently estimated at $664,157, approximately $244 per square foot. 1060 N Saint Vrain Ave is a home located in Larimer County with nearby schools including Estes Park K-5 School, Estes Park Options School, and Estes Park Middle School.
Ownership History
Date
Name
Owned For
Owner Type
Purchase Details
Closed on
Jan 31, 2020
Sold by
Wandas Mark
Bought by
Benes Kevin
Current Estimated Value
Home Financials for this Owner
Home Financials are based on the most recent Mortgage that was taken out on this home.
Original Mortgage
$395,200
Outstanding Balance
$350,585
Interest Rate
3.7%
Mortgage Type
New Conventional
Estimated Equity
$313,572
Purchase Details
Closed on
Jun 13, 2013
Sold by
Haughey Robert J and Haughey Catherine F
Bought by
Wandas Mark
Home Financials for this Owner
Home Financials are based on the most recent Mortgage that was taken out on this home.
Original Mortgage
$270,019
Interest Rate
3.25%
Mortgage Type
FHA
Purchase Details
Closed on
Aug 1, 1995
Sold by
Lee Nancy A
Bought by
Haughey Robert J
Purchase Details
Closed on
Oct 1, 1992
Sold by
Busch Maxine M
Bought by
Lee Robert C
Create a Home Valuation Report for This Property
The Home Valuation Report is an in-depth analysis detailing your home's value as well as a comparison with similar homes in the area
Home Values in the Area
Average Home Value in this Area
Purchase History
| Date | Buyer | Sale Price | Title Company |
|---|---|---|---|
| Benes Kevin | $416,000 | Rocky Mountain Title | |
| Wandas Mark | $275,000 | Fidelity National Title Insu | |
| Haughey Robert J | $126,000 | -- | |
| Lee Robert C | $81,000 | -- |
Source: Public Records
Mortgage History
| Date | Status | Borrower | Loan Amount |
|---|---|---|---|
| Open | Benes Kevin | $395,200 | |
| Previous Owner | Wandas Mark | $270,019 |
Source: Public Records
Tax History Compared to Growth
Tax History
| Year | Tax Paid | Tax Assessment Tax Assessment Total Assessment is a certain percentage of the fair market value that is determined by local assessors to be the total taxable value of land and additions on the property. | Land | Improvement |
|---|---|---|---|---|
| 2025 | $2,566 | $38,713 | $9,581 | $29,132 |
| 2024 | $2,522 | $38,713 | $9,581 | $29,132 |
| 2022 | $2,216 | $29,024 | $7,298 | $21,726 |
| 2021 | $2,276 | $29,859 | $7,508 | $22,351 |
| 2020 | $2,268 | $29,387 | $5,842 | $23,545 |
| 2019 | $2,256 | $29,387 | $5,842 | $23,545 |
| 2018 | $2,052 | $25,927 | $5,882 | $20,045 |
| 2017 | $2,063 | $25,927 | $5,882 | $20,045 |
| 2016 | $1,755 | $23,370 | $6,503 | $16,867 |
| 2015 | $1,773 | $28,350 | $6,500 | $21,850 |
| 2014 | $1,654 | $22,360 | $6,500 | $15,860 |
Source: Public Records
Map
Nearby Homes
- 219 3rd St
- 261 South Ct
- 407 Stanley Ave
- TBD Stanley Ave
- Lot 744 St Vrain Dr Unit 4723401238
- Lot 744 St Vrain Dr
- 557 Grand Estates Dr
- 450 Hillside Ln Unit A/B
- 550 Grand Estates Dr
- 435 Columbine Ave
- 445 Skyline Dr
- 517 Birch Ave
- 404 Elm Ave
- 659 Morgan St
- 603 Aspen Ave Unit B4
- 603 Aspen Ave Unit C1
- 635 Community Dr
- 950 Big Thompson Ave Unit A1152
- 654 Morgan St
- 500 Elm Ave