

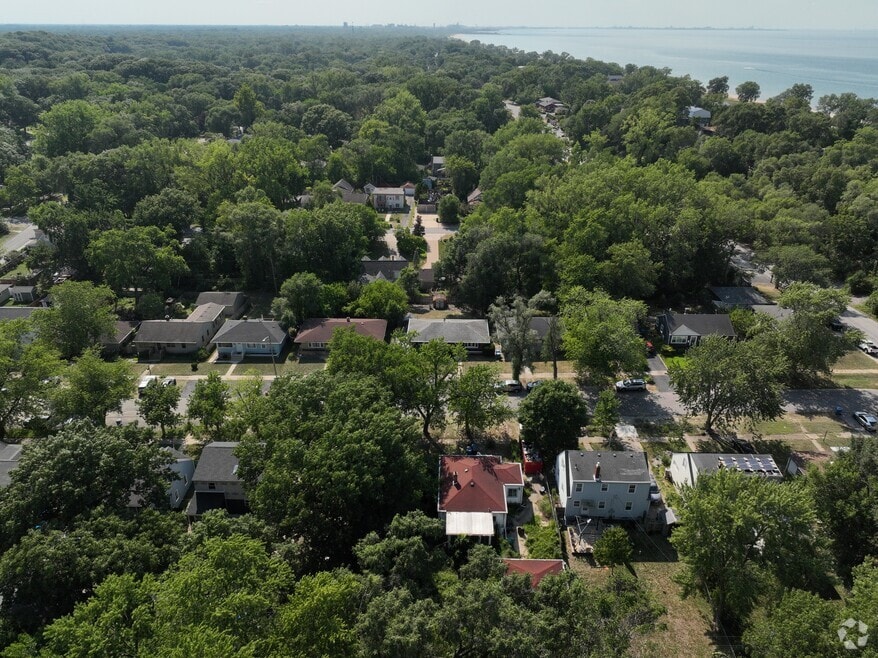


1060 N Vanderburg St Gary, IN 46403
Miller NeighborhoodEstimated payment $2,172/month
Total Views
151,947
3
Beds
2
Baths
2,288
Sq Ft
$133
Price per Sq Ft
Highlights
- No HOA
- Living Room
- 1-Story Property
- Neighborhood Views
- Tile Flooring
- Forced Air Heating and Cooling System
About This Home
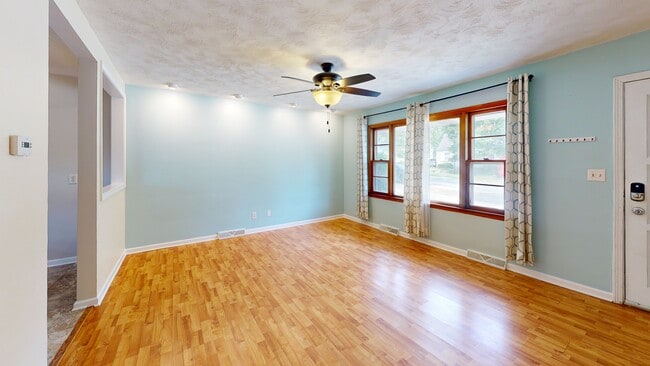
Straight, short walk to the Beach, just 200 yards from the front door of this all brick, 3 bedroom, 2 full bath home, with a beautifully finished basement family room with an additional bedroom. Walk south 300 yards to the Bayless Dune Trail and the Indiana Dunes National Park. Interior features include remodeled kitchen and bath, large windows that create light filled rooms. Be sure to check this one out!
Home Details
Home Type
- Single Family
Est. Annual Taxes
- $6,792
Year Built
- Built in 1961
Lot Details
- 7,579 Sq Ft Lot
- Back Yard Fenced
Parking
- Off-Street Parking
Home Design
- Brick Foundation
Interior Spaces
- 1-Story Property
- Living Room
- Dining Room
- Neighborhood Views
- Basement
Flooring
- Tile
- Vinyl
Bedrooms and Bathrooms
- 3 Bedrooms
- 2 Full Bathrooms
Laundry
- Laundry on lower level
- Washer and Gas Dryer Hookup
Utilities
- Forced Air Heating and Cooling System
- Heating System Uses Natural Gas
Community Details
- No Home Owners Association
- Lake Shore Add East Chicago Subdivision
Listing and Financial Details
- Assessor Parcel Number 450533206021000004
3D Interior and Exterior Tours
Floorplans
Map
Create a Home Valuation Report for This Property
The Home Valuation Report is an in-depth analysis detailing your home's value as well as a comparison with similar homes in the area
Home Values in the Area
Average Home Value in this Area
Tax History
| Year | Tax Paid | Tax Assessment Tax Assessment Total Assessment is a certain percentage of the fair market value that is determined by local assessors to be the total taxable value of land and additions on the property. | Land | Improvement |
|---|---|---|---|---|
| 2024 | $24,502 | $268,400 | $111,800 | $156,600 |
| 2023 | $2,255 | $277,900 | $121,000 | $156,900 |
| 2022 | $2,255 | $179,000 | $33,700 | $145,300 |
| 2021 | $2,077 | $165,900 | $33,200 | $132,700 |
| 2020 | $2,029 | $162,400 | $33,200 | $129,200 |
| 2019 | $1,641 | $159,000 | $32,700 | $126,300 |
| 2018 | $1,424 | $128,300 | $26,700 | $101,600 |
| 2017 | $1,454 | $129,200 | $26,700 | $102,500 |
| 2016 | $1,475 | $132,600 | $25,400 | $107,200 |
| 2014 | $1,553 | $133,900 | $26,100 | $107,800 |
| 2013 | $1,448 | $129,500 | $26,100 | $103,400 |
Source: Public Records
Property History
| Date | Event | Price | List to Sale | Price per Sq Ft |
|---|---|---|---|---|
| 09/30/2025 09/30/25 | Price Changed | $304,999 | -4.2% | $133 / Sq Ft |
| 08/15/2025 08/15/25 | For Sale | $318,500 | -- | $139 / Sq Ft |
Source: Northwest Indiana Association of REALTORS®
Purchase History
| Date | Type | Sale Price | Title Company |
|---|---|---|---|
| Warranty Deed | -- | Chicago Title Insurance Co | |
| Deed | -- | Metropolitan Title In Llc |
Source: Public Records
Mortgage History
| Date | Status | Loan Amount | Loan Type |
|---|---|---|---|
| Previous Owner | $97,465 | FHA | |
| Previous Owner | $114,800 | Purchase Money Mortgage |
Source: Public Records
About the Listing Agent
One hundred and two years is just a blink of an eye in terms of world history but by most standards it's a long time for a family-owned business to continually operate.
The first Ayers in the real estate business was N. Guy Ayers. Great Uncle Guy was born on a farm near Peoria, Illinois in 1888. As a young man, Guy tried mining in Colorado before coming to the rapidly growing steel mill town of Gary, Indiana. A newspaper ad from 1921 advertises property for sale through a real estate
Gene's Other Listings
Source: Northwest Indiana Association of REALTORS®
MLS Number: 826065
APN: 45-05-33-206-021.000-004
Disclaimer: Certain information contained herein is derived from information provided by parties other than Homes.com. All information provided is deemed reliable, but is not guaranteed to be accurate and should be independently verified.
![]() Copyright 2025 MuItiple Listing Service of the Northwest Indiana Realtors Association Multiple Listing Service (NIRA MLS). All rights reserved. IDX information is provided exclusively for personal, non-commercial use, and may not be used for any purpose other than to identify prospective properties consumers may be interested in purchasing. Information is deemed reliable but not guaranteed.
Copyright 2025 MuItiple Listing Service of the Northwest Indiana Realtors Association Multiple Listing Service (NIRA MLS). All rights reserved. IDX information is provided exclusively for personal, non-commercial use, and may not be used for any purpose other than to identify prospective properties consumers may be interested in purchasing. Information is deemed reliable but not guaranteed.
Nearby Homes
- 1025 N Vanderburg St
- 8724 Oak Ave
- 910 N Vanderburg St
- 1071 N Warren St
- 925 N Warren St
- 1144 N Warrick St
- 1045 N Shelby St
- 7824 Maple Ave
- 7632 Maple Ave
- 9426 Oak Ave
- 8614-26 Indian Boundary
- 8726 Lakewood Ave
- 551 N Union Place
- 8841 Hemlock Ln
- 701 N Randolph St
- 8234 Hickory Ave
- 1133 Putnam St
- 8120 Lakewood Ave
- 7840 Indian Boundary
- 8000 Forest Ave
- 440 N Lake St
- 234 N Hamilton St Unit ID1332553P
- 234 N Hamilton St
- 234 N Hamilton St Unit ID1253030P
- 55 Aspen Rd
- 5966 Beacon Ln
- 350 Fayette St
- 5211 Rachel Ave
- 5271 Concord Ave Unit A
- 6248 Kathryn Ct Unit A
- 6248 Kathryn Ct Unit D
- 2921 Brown St
- 1252 Idaho St
- 5423 Stone Ave
- 2540 Promenade Way
- 2828 Eleanor St
- 6676 Lakewood Ave
- 6155 Brie Ave
- 5990 Wonderland Dr
- 708 Vermont St