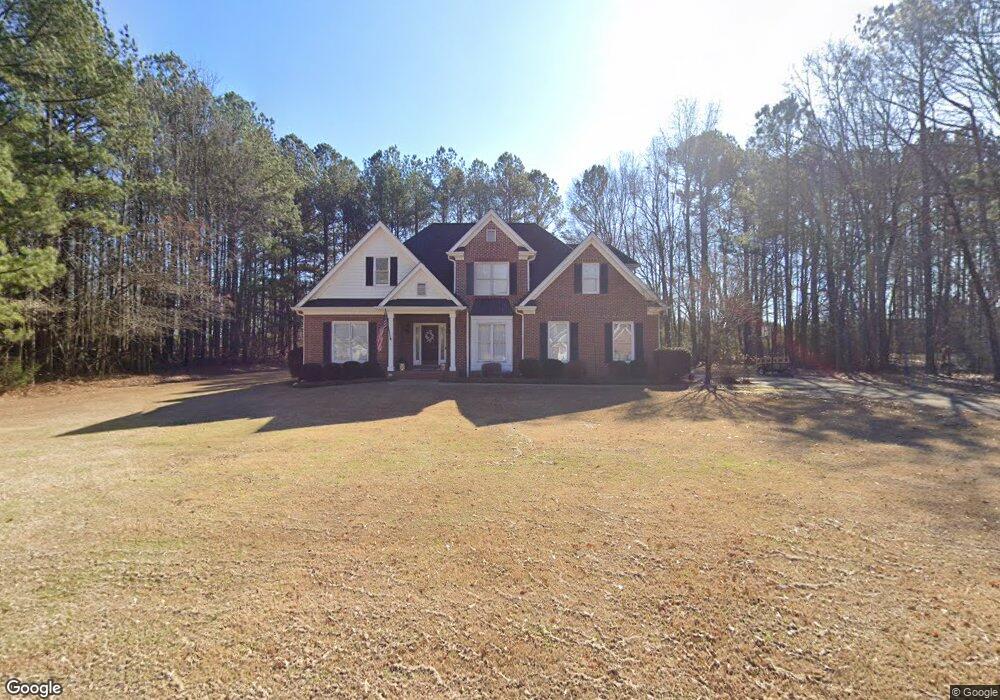
1060 Oconee Crossing Cir Watkinsville, GA 30677
Estimated Value: $535,751 - $625,000
--
Bed
--
Bath
2,167
Sq Ft
$263/Sq Ft
Est. Value
About This Home
This home is located at 1060 Oconee Crossing Cir, Watkinsville, GA 30677 and is currently estimated at $570,938, approximately $263 per square foot. 1060 Oconee Crossing Cir is a home located in Oconee County with nearby schools including Rocky Branch Elementary School, Malcom Bridge Middle School, and North Oconee High School.
Ownership History
Date
Name
Owned For
Owner Type
Purchase Details
Closed on
Oct 1, 2018
Sold by
Glessing David A
Bought by
Vanstone Joseph M and Vanstone Casey Noelle
Current Estimated Value
Home Financials for this Owner
Home Financials are based on the most recent Mortgage that was taken out on this home.
Original Mortgage
$309,775
Outstanding Balance
$269,027
Interest Rate
4.5%
Estimated Equity
$301,911
Purchase Details
Closed on
Apr 18, 1996
Sold by
First South Homes I
Bought by
Glessing David A
Create a Home Valuation Report for This Property
The Home Valuation Report is an in-depth analysis detailing your home's value as well as a comparison with similar homes in the area
Home Values in the Area
Average Home Value in this Area
Purchase History
| Date | Buyer | Sale Price | Title Company |
|---|---|---|---|
| Vanstone Joseph M | $310,000 | -- | |
| Glessing David A | $153,100 | -- |
Source: Public Records
Mortgage History
| Date | Status | Borrower | Loan Amount |
|---|---|---|---|
| Open | Vanstone Joseph M | $309,775 |
Source: Public Records
Tax History Compared to Growth
Tax History
| Year | Tax Paid | Tax Assessment Tax Assessment Total Assessment is a certain percentage of the fair market value that is determined by local assessors to be the total taxable value of land and additions on the property. | Land | Improvement |
|---|---|---|---|---|
| 2024 | $3,816 | $179,943 | $30,000 | $149,943 |
| 2023 | $3,373 | $168,291 | $26,000 | $142,291 |
| 2022 | $3,227 | $150,198 | $26,000 | $124,198 |
| 2021 | $2,961 | $127,809 | $20,000 | $107,809 |
| 2020 | $2,629 | $113,300 | $20,000 | $93,300 |
| 2019 | $2,593 | $109,750 | $20,000 | $89,750 |
| 2018 | $2,168 | $91,490 | $20,000 | $71,490 |
| 2017 | $2,010 | $84,818 | $20,000 | $64,818 |
| 2016 | $1,928 | $81,368 | $20,000 | $61,368 |
| 2015 | $1,866 | $78,570 | $20,000 | $58,570 |
| 2014 | $1,818 | $74,891 | $24,000 | $50,891 |
| 2013 | -- | $73,224 | $24,000 | $49,224 |
Source: Public Records
Map
Nearby Homes
- 1450 Lincoln Dr
- 6441 Hog Mountain Rd
- 1462 Brookstone Crossing
- 1110 Brookstone Place
- 4611 Monroe Hwy - Hwy 78 Unit PARCEL C
- 4611 Monroe Hwy - Hwy 78
- 1111 Brookstone Crossing Unit 11D
- 1901 Hog Mountain Rd
- 1921 Hog Mountain Rd
- N/A Hog Mountain Rd
- 1111 Brookside Terrace Unit 2011D
- 1111 Brookside Terrace
- 1111 Brookside Terrace Unit 2011D
- 1621 Westland Ct
- 1621 Westland Ct Unit 2014 B
- 1547 Westland Ct
- 1383 Westland Ct Unit 17D
- 1383 Westland Ct
- 1383 Westland Ct Unit 17D
- 1383 Westland Ct
- 1060 Oconee Crossing Cir
- 1080 Oconee Crossing Cir
- 1040 Oconee Crossing Cir
- 1021 Elyse Dr
- 1090 Oconee Crossing Cir
- 1081 Vanessa Ave
- 1030 Oconee Crossing Cir
- 1051 Oconee Crossing Cir
- 1071 Oconee Crossing Cir
- 1020 Elyse Dr
- 1041 Oconee Crossing Cir
- 1071 Vanessa Ave
- 1081 Oconee Crossing Cir
- 1060 Elyse Dr
- 1011 Oconee Crossing Cir
- 1110 Oconee Crossing Cir
- 1011 Oconee Crossing Cir
- 1081 Crossing Ridge
- 1081 Crossing Ridge
- 1010 Oconee Crossing Cir