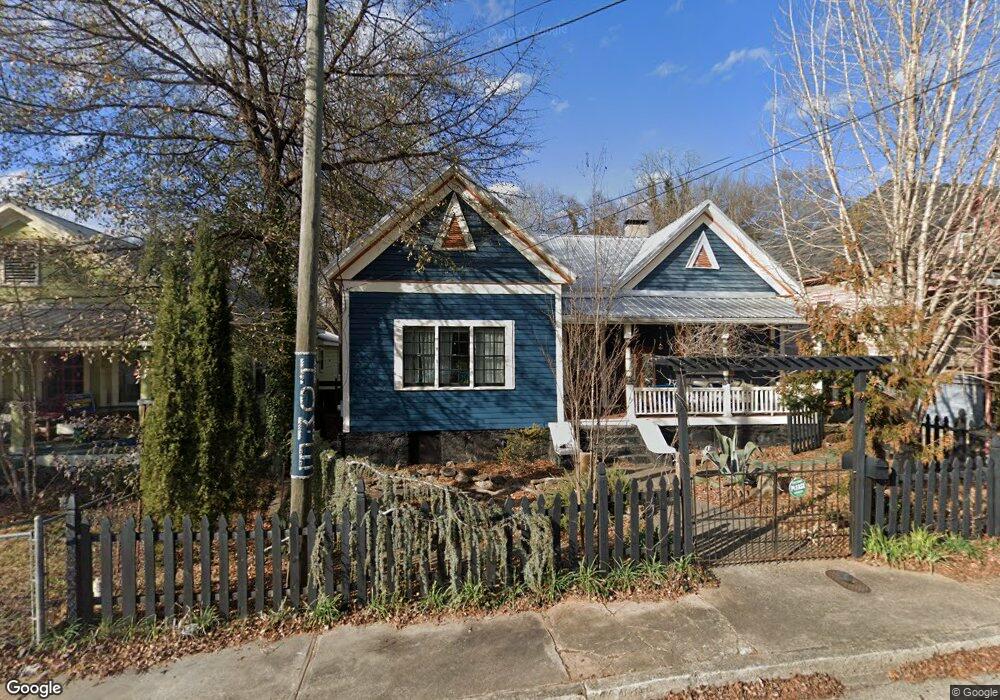
1060 Reese St Athens, GA 30606
Cobbham NeighborhoodEstimated Value: $321,000 - $344,843
2
Beds
2
Baths
1,399
Sq Ft
$237/Sq Ft
Est. Value
About This Home
This home is located at 1060 Reese St, Athens, GA 30606 and is currently estimated at $332,211, approximately $237 per square foot. 1060 Reese St is a home located in Clarke County with nearby schools including Johnnie Lay Burks Elementary School, Clarke Middle School, and Clarke Central High School.
Ownership History
Date
Name
Owned For
Owner Type
Purchase Details
Closed on
May 21, 2018
Sold by
Haedicke Stephen J
Bought by
Peters Miki L and Peters Nathan D
Current Estimated Value
Home Financials for this Owner
Home Financials are based on the most recent Mortgage that was taken out on this home.
Original Mortgage
$114,000
Outstanding Balance
$97,947
Interest Rate
4.4%
Mortgage Type
New Conventional
Estimated Equity
$234,264
Purchase Details
Closed on
Jul 20, 2004
Sold by
Gustafson-Peters Nathan and Gustafson-Peters Miki
Bought by
Haedicke Stephen J and Haedicke Jennifer R
Purchase Details
Closed on
Jun 30, 2003
Sold by
Moore Bryan G and Moore Beatrice G
Bought by
Gustafson-Peters Nathan and Miki Lu
Purchase Details
Closed on
Aug 26, 1999
Sold by
Hanley David and Danny Hanley
Bought by
Moore Bryan G and Elder Beatrice G
Purchase Details
Closed on
Jun 17, 1999
Sold by
Dorsey Robert P
Bought by
Hanley David and Danny Hanley
Create a Home Valuation Report for This Property
The Home Valuation Report is an in-depth analysis detailing your home's value as well as a comparison with similar homes in the area
Home Values in the Area
Average Home Value in this Area
Purchase History
| Date | Buyer | Sale Price | Title Company |
|---|---|---|---|
| Peters Miki L | $142,500 | -- | |
| Haedicke Stephen J | $141,500 | -- | |
| Gustafson-Peters Nathan | $127,000 | -- | |
| Moore Bryan G | $85,000 | -- | |
| Hanley David | $57,000 | -- |
Source: Public Records
Mortgage History
| Date | Status | Borrower | Loan Amount |
|---|---|---|---|
| Open | Peters Miki L | $114,000 |
Source: Public Records
Tax History Compared to Growth
Tax History
| Year | Tax Paid | Tax Assessment Tax Assessment Total Assessment is a certain percentage of the fair market value that is determined by local assessors to be the total taxable value of land and additions on the property. | Land | Improvement |
|---|---|---|---|---|
| 2025 | $3,362 | $130,047 | $28,000 | $102,047 |
| 2024 | $3,362 | $115,248 | $20,000 | $95,248 |
| 2023 | $2,049 | $100,565 | $20,000 | $80,565 |
| 2022 | $2,531 | $89,334 | $20,000 | $69,334 |
| 2021 | $2,056 | $71,020 | $20,000 | $51,020 |
| 2020 | $1,884 | $65,891 | $20,000 | $45,891 |
| 2019 | $1,596 | $59,840 | $20,000 | $39,840 |
| 2018 | $1,662 | $48,961 | $14,000 | $34,961 |
| 2017 | $1,588 | $46,777 | $12,000 | $34,777 |
| 2016 | $1,576 | $46,407 | $12,000 | $34,407 |
| 2015 | $1,308 | $38,465 | $12,000 | $26,465 |
| 2014 | $1,310 | $38,466 | $12,000 | $26,466 |
Source: Public Records
Map
Nearby Homes
- 1198 W West Hancock Ave W
- 1196 W Hancock Ave Unit 1
- 1226 W Broad St
- 480 N Billups St
- 1398 W Hancock Ave
- 597 Dearing St
- 500 Dearing St Unit 6
- 552 Cobb St
- 283 King Ave
- 468 N Milledge Ave Unit 203
- 290 Hodgson Dr
- 525 King Ave
- 100 Crestview Cir
- 257 Hill St
- 570 Prince Ave
- 365 S Church St Unit 1A, 1B, 1C
- 1055 Baxter St Unit 504
- 338 Springdale St
- 145 Sunset Dr
- 215 Holman Ave
- 1052 Reese St
- 1072 Reese St
- 1042 Reese St
- 0 S Rocksprings St Unit 3127001
- 0 S Rocksprings St Unit 3126886
- 0 S Rocksprings St Unit 3126885
- 260 N Rocksprings St
- 1082 Reese St
- 274 N Rocksprings St
- 237 N Billups St
- 223 N Billups St
- 1053 Reese St
- 249 N Billups St
- 1267 W Hancock Ave
- 1043 Reese St
- N N Rocksprings St
- N N Rocksprings St
- 1247 W Hancock Ave Unit 1257
- 1247 W Hancock Ave
- 298 N Rocksprings St