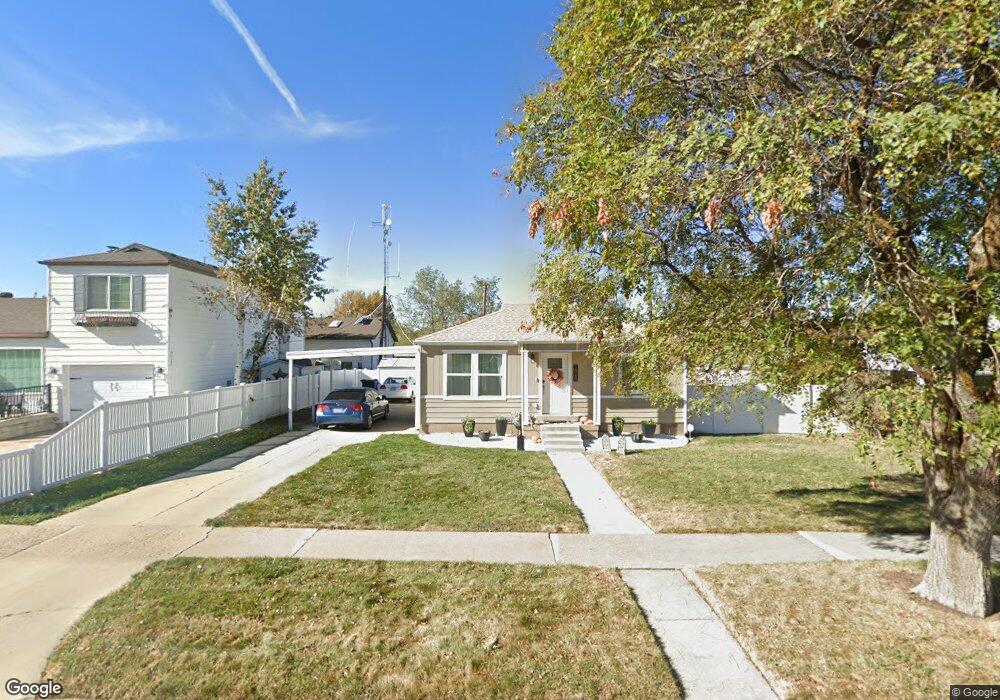
1060 S 100 E Bountiful, UT 84010
Estimated Value: $513,000 - $580,000
4
Beds
2
Baths
1,952
Sq Ft
$273/Sq Ft
Est. Value
About This Home
This home is located at 1060 S 100 E, Bountiful, UT 84010 and is currently estimated at $533,072, approximately $273 per square foot. 1060 S 100 E is a home located in Davis County with nearby schools including Bountiful Elementary School, Millcreek Junior High School, and Bountiful High School.
Ownership History
Date
Name
Owned For
Owner Type
Purchase Details
Closed on
May 1, 2020
Sold by
Luker Mckay D and Luker Lauren V
Bought by
Hollberg Jelina and Hollberg Coleman
Current Estimated Value
Home Financials for this Owner
Home Financials are based on the most recent Mortgage that was taken out on this home.
Original Mortgage
$358,900
Outstanding Balance
$319,132
Interest Rate
3.6%
Mortgage Type
New Conventional
Estimated Equity
$213,941
Purchase Details
Closed on
Jan 28, 2019
Sold by
Plummer Zachary R and Plummer Leslie M
Bought by
Luker Mckay D and Luker Lauren V
Home Financials for this Owner
Home Financials are based on the most recent Mortgage that was taken out on this home.
Original Mortgage
$285,859
Interest Rate
4.6%
Mortgage Type
New Conventional
Purchase Details
Closed on
Feb 12, 2016
Sold by
Phelps Stock Inc
Bought by
Plummer Zachary R and Plummer Leslie M
Purchase Details
Closed on
Feb 27, 2015
Sold by
Christensen Evan D
Bought by
Phelps Stock Inc
Create a Home Valuation Report for This Property
The Home Valuation Report is an in-depth analysis detailing your home's value as well as a comparison with similar homes in the area
Purchase History
| Date | Buyer | Sale Price | Title Company |
|---|---|---|---|
| Hollberg Jelina | -- | Vanguard Title Ins Un | |
| Luker Mckay D | -- | Title Guarantee La | |
| Plummer Zachary R | -- | Backman Title Services | |
| Phelps Stock Inc | -- | Backman Title Services |
Source: Public Records
Mortgage History
| Date | Status | Borrower | Loan Amount |
|---|---|---|---|
| Open | Hollberg Jelina | $358,900 | |
| Previous Owner | Luker Mckay D | $285,859 |
Source: Public Records
Tax History
| Year | Tax Paid | Tax Assessment Tax Assessment Total Assessment is a certain percentage of the fair market value that is determined by local assessors to be the total taxable value of land and additions on the property. | Land | Improvement |
|---|---|---|---|---|
| 2025 | $2,812 | $253,000 | $133,804 | $119,196 |
| 2024 | $2,613 | $244,200 | $120,006 | $124,194 |
| 2023 | $2,490 | $422,000 | $220,402 | $201,598 |
| 2022 | $2,725 | $254,650 | $120,249 | $134,401 |
| 2021 | $2,535 | $363,000 | $157,390 | $205,610 |
| 2020 | $2,231 | $320,000 | $134,191 | $185,809 |
| 2019 | $2,015 | $280,000 | $139,998 | $140,002 |
| 2018 | $220 | $246,000 | $137,192 | $108,808 |
| 2016 | $1,501 | $110,055 | $57,424 | $52,631 |
| 2015 | $1,460 | $98,230 | $57,424 | $40,806 |
| 2014 | $1,558 | $111,870 | $57,424 | $54,446 |
| 2013 | -- | $90,769 | $43,945 | $46,824 |
Source: Public Records
Map
Nearby Homes
- 285 E 1100 S
- 545 S 100 E
- 650 S Main St Unit 6206
- 650 S Main St Unit 4104
- 650 S Main St Unit 9106
- 141 E 1650 S
- 323 Peach Ln
- 275 E Peach Ln S
- 1350 S 200 W
- 380 E 1500 S
- 1314 S 200 W Unit 19
- 288 E 1650 S
- 34 W 400 S
- 520 S Orchard Dr Unit 17
- 32 W 400 S
- 357 S 100 E
- 255 E 400 S
- 456 E 500 S
- 1820 S 50 W
- 1016 S 400 W
Your Personal Tour Guide
Ask me questions while you tour the home.