1060 Sagewood Ln Salisbury, NC 28146
Estimated Value: $266,351 - $342,000
--
Bed
2
Baths
1,290
Sq Ft
$238/Sq Ft
Est. Value
About This Home
This home is located at 1060 Sagewood Ln, Salisbury, NC 28146 and is currently estimated at $306,588, approximately $237 per square foot. 1060 Sagewood Ln is a home located in Rowan County with nearby schools including Ethan H Shive Elementary School, China Grove Middle School, and Jesse C Carson High School.
Ownership History
Date
Name
Owned For
Owner Type
Purchase Details
Closed on
Jul 20, 2012
Sold by
Moore Patricia L
Bought by
Murphy Charlene T
Current Estimated Value
Home Financials for this Owner
Home Financials are based on the most recent Mortgage that was taken out on this home.
Original Mortgage
$21,600
Interest Rate
3.7%
Mortgage Type
Purchase Money Mortgage
Purchase Details
Closed on
Sep 12, 2006
Sold by
Efird Lester C and Efird Lydia W
Bought by
Murphy Wichita E and Murphy Charlene
Home Financials for this Owner
Home Financials are based on the most recent Mortgage that was taken out on this home.
Original Mortgage
$102,400
Interest Rate
6.67%
Mortgage Type
Purchase Money Mortgage
Purchase Details
Closed on
Jan 26, 2006
Sold by
Hudson Construction
Bought by
Efird Lester C and Efird Lydia W
Create a Home Valuation Report for This Property
The Home Valuation Report is an in-depth analysis detailing your home's value as well as a comparison with similar homes in the area
Home Values in the Area
Average Home Value in this Area
Purchase History
| Date | Buyer | Sale Price | Title Company |
|---|---|---|---|
| Murphy Charlene T | $27,000 | None Available | |
| Murphy Wichita E | $128,000 | Secured Title Llc | |
| Efird Lester C | $23,000 | None Available |
Source: Public Records
Mortgage History
| Date | Status | Borrower | Loan Amount |
|---|---|---|---|
| Closed | Murphy Charlene T | $21,600 | |
| Previous Owner | Murphy Wichita E | $102,400 |
Source: Public Records
Tax History Compared to Growth
Tax History
| Year | Tax Paid | Tax Assessment Tax Assessment Total Assessment is a certain percentage of the fair market value that is determined by local assessors to be the total taxable value of land and additions on the property. | Land | Improvement |
|---|---|---|---|---|
| 2025 | $1,268 | $189,256 | $30,000 | $159,256 |
| 2024 | $1,268 | $189,256 | $30,000 | $159,256 |
| 2023 | $1,268 | $189,256 | $30,000 | $159,256 |
| 2022 | $990 | $132,422 | $28,500 | $103,922 |
| 2021 | $983 | $132,422 | $28,500 | $103,922 |
| 2020 | $983 | $132,422 | $28,500 | $103,922 |
| 2019 | $983 | $132,422 | $28,500 | $103,922 |
| 2018 | $845 | $114,818 | $28,500 | $86,318 |
| 2017 | $845 | $114,818 | $28,500 | $86,318 |
| 2016 | $845 | $114,818 | $28,500 | $86,318 |
| 2015 | $858 | $114,818 | $28,500 | $86,318 |
| 2014 | $836 | $117,426 | $28,500 | $88,926 |
Source: Public Records
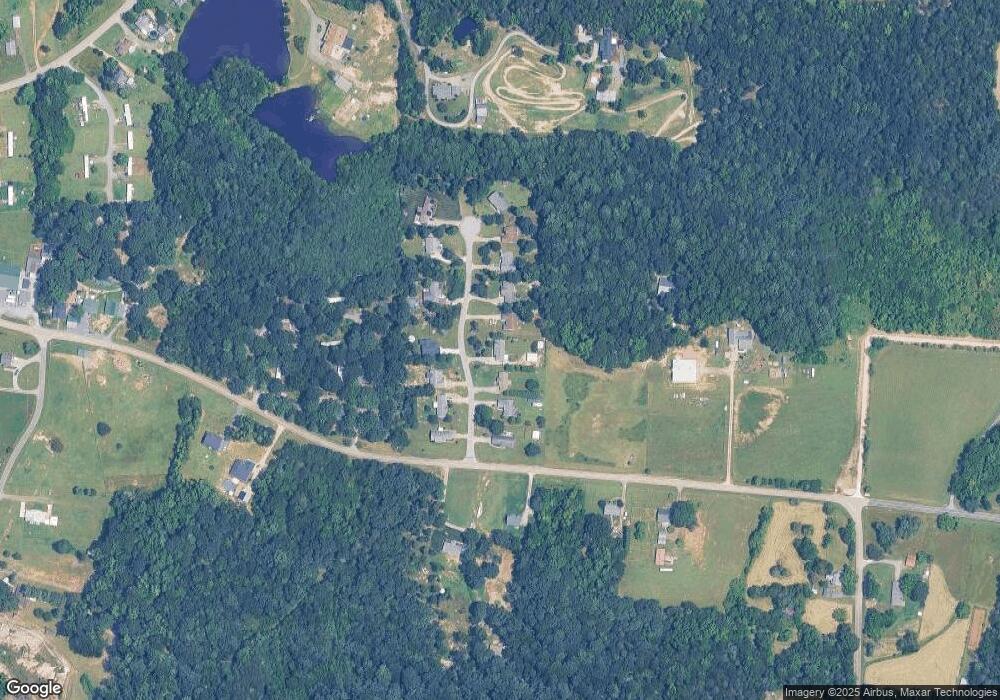
Map
Nearby Homes
- 294 Wingate Ln
- 295 Wingate Ln
- 1008 Courtney Ln Unit 28
- 130 Happy Hollow Rd
- 130 Happy Hollow Rd Unit 13/B
- 175 Sun Valley Dr
- 35 Happy Hollow Rd
- 4505 Cook Rd
- 4550 Cook Rd
- 107 Mink Dr
- 0 Maple St
- 235 Timber Creek Ln
- 1143 Journey Ln
- 225 Lm Overcash Rd
- 5604 N Carolina 152
- 210 Rattlesnake St
- 8900 Old Concord Rd
- 425 Acorn Oaks Dr
- 5037 Faith Rd
- 825 Lippard Rd
- 1078 Sagewood Ln
- 1044 Sagewood Ln
- 1096 Sagewood Ln
- 1026 Sagewood Ln
- 1067 Sagewood Ln
- 1067 Sagewood Ln Unit 4
- 1045 Sagewood Ln
- 1110 Sagewood Ln
- 1008 Sagewood Ln
- 1088 Sagewood Ln
- 1027 Sagewood Ln
- 1009 Sagewood Ln
- 1126 Sagewood Ln
- 1125 Sagewood Ln
- 1125 Sagewood Ln Unit 6
- 1134 Sagewood Ln
- 1151 Sagewood Ln
- 780 Parks Rd
- 830 Parks Rd
- 750 Parks Rd