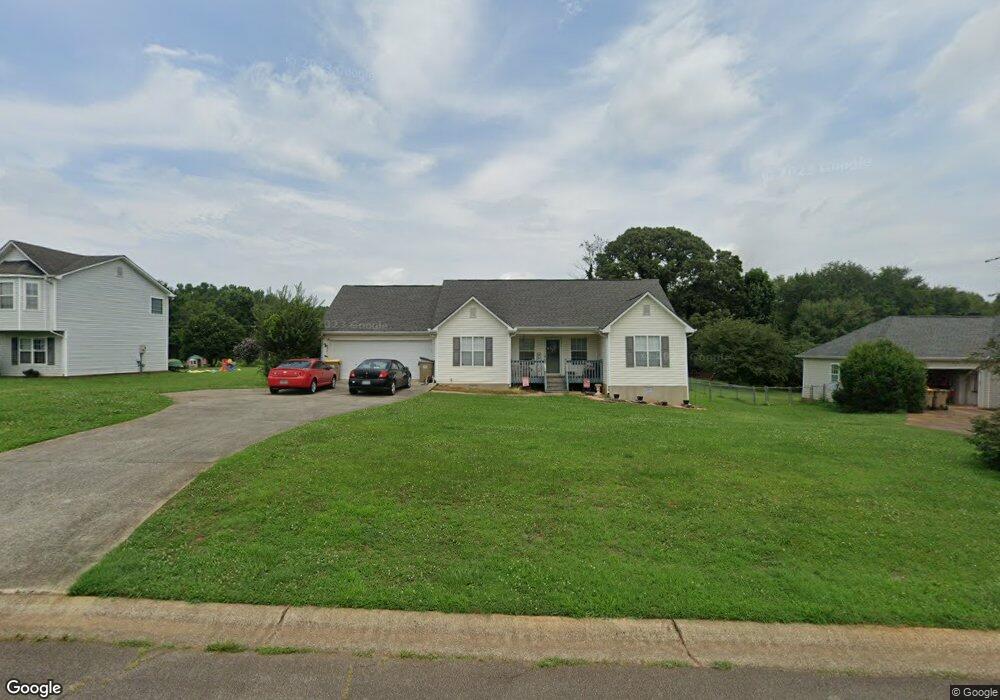
1060 Taylor Ct Unit II Winder, GA 30680
Estimated Value: $329,061 - $357,000
3
Beds
2
Baths
1,622
Sq Ft
$211/Sq Ft
Est. Value
About This Home
This home is located at 1060 Taylor Ct Unit II, Winder, GA 30680 and is currently estimated at $341,765, approximately $210 per square foot. 1060 Taylor Ct Unit II is a home located in Barrow County with nearby schools including Holsenbeck Elementary School, Bear Creek Middle School, and Winder-Barrow High School.
Ownership History
Date
Name
Owned For
Owner Type
Purchase Details
Closed on
Jan 15, 2023
Sold by
Lyons Rachel B Estate
Bought by
Lyons Steven Jay
Current Estimated Value
Purchase Details
Closed on
May 24, 1999
Sold by
Pierce Danny
Bought by
Lyons Rachel B
Home Financials for this Owner
Home Financials are based on the most recent Mortgage that was taken out on this home.
Original Mortgage
$70,000
Interest Rate
6.84%
Mortgage Type
New Conventional
Purchase Details
Closed on
Jan 8, 1999
Sold by
Patterson Phillip R and Patterson Brenda E
Bought by
Pierce Danny
Home Financials for this Owner
Home Financials are based on the most recent Mortgage that was taken out on this home.
Original Mortgage
$74,250
Interest Rate
6.77%
Mortgage Type
Construction
Purchase Details
Closed on
May 22, 1980
Bought by
Patterson Ray and Patterson Bren
Create a Home Valuation Report for This Property
The Home Valuation Report is an in-depth analysis detailing your home's value as well as a comparison with similar homes in the area
Home Values in the Area
Average Home Value in this Area
Purchase History
| Date | Buyer | Sale Price | Title Company |
|---|---|---|---|
| Lyons Steven Jay | -- | -- | |
| Lyons Rachel B | $100,400 | -- | |
| Pierce Danny | $16,000 | -- | |
| Patterson Ray | -- | -- |
Source: Public Records
Mortgage History
| Date | Status | Borrower | Loan Amount |
|---|---|---|---|
| Previous Owner | Lyons Rachel B | $70,000 | |
| Previous Owner | Pierce Danny | $74,250 |
Source: Public Records
Tax History
| Year | Tax Paid | Tax Assessment Tax Assessment Total Assessment is a certain percentage of the fair market value that is determined by local assessors to be the total taxable value of land and additions on the property. | Land | Improvement |
|---|---|---|---|---|
| 2025 | $2,629 | $108,899 | $24,000 | $84,899 |
| 2024 | $2,674 | $106,428 | $24,000 | $82,428 |
| 2023 | $2,199 | $87,100 | $18,000 | $69,100 |
| 2022 | $503 | $63,184 | $16,000 | $47,184 |
| 2021 | $527 | $63,184 | $16,000 | $47,184 |
| 2020 | $512 | $63,184 | $16,000 | $47,184 |
| 2019 | $533 | $63,184 | $16,000 | $47,184 |
| 2018 | $473 | $57,153 | $12,000 | $45,153 |
| 2017 | $1,275 | $43,774 | $12,000 | $31,774 |
| 2016 | $391 | $44,142 | $12,000 | $32,142 |
| 2015 | $398 | $44,511 | $12,000 | $32,511 |
| 2014 | $651 | $38,759 | $5,880 | $32,879 |
| 2013 | -- | $36,832 | $5,880 | $30,952 |
Source: Public Records
Map
Nearby Homes
- 388 Kay Dr Unit 1
- 917 Justin Dr Unit 3
- 1556 Shoal Creek Dr
- 1553 Shoal Creek Dr
- 614 Anns Way
- 508 Pleasant Hill Church Rd NE
- 56 Candler Park Ct
- 973 Vera Ct
- 246 Pleasant Hill Church Rd NE
- 63 Delightful Way Unit 1
- 698 Melinda Dr
- 162 Delightful Way Unit 28
- 253 Delightful Way Unit 6
- 230 Delightful Way Unit 23
- 281 Delightful Way Unit 7
- 296 Delightful Way Unit 22
- 16 Fox Dr
- 83 Beech Creek Cir
- 385 Finch Landing Rd
- 91 Beech Creek Cir
- 1058 Taylor Ct
- 1062 Taylor Ct
- 751 Taylor Ct Unit 33
- 751 Taylor Ct
- 739 Taylor Ct Unit 30
- 737 Taylor Ct Unit 29
- 733 Taylor Ct Unit 27
- 715 Taylor Ct Unit 20
- 1056 Taylor Ct Unit 24
- 1056 Taylor Ct Unit 2
- 1056 Taylor Ct
- 719 Taylor Ct Unit 22
- 709 Taylor Ct Unit 18
- 1064 Taylor Ct
- 501 Stoney Creek Dr
- 1054 Taylor Ct Unit 2
- 1061 Taylor Ct Unit 2
- 1059 Taylor Ct
- 1066 Taylor Ct
- 500 Stoney Creek Rd
Your Personal Tour Guide
Ask me questions while you tour the home.