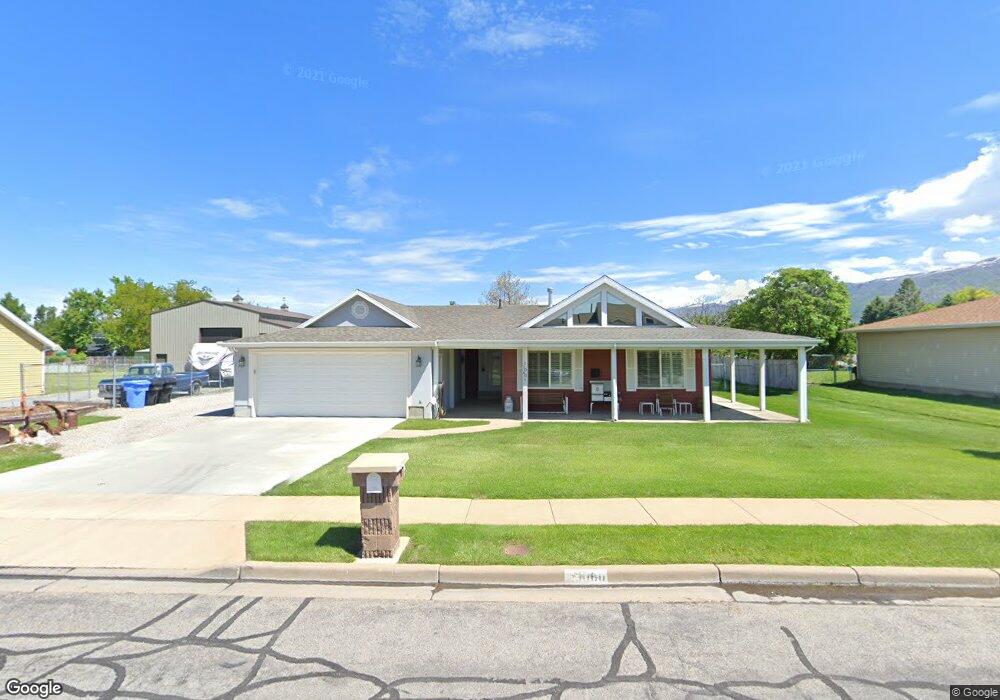
1060 W 600 N West Bountiful, UT 84087
Estimated Value: $596,302 - $1,123,000
4
Beds
2
Baths
1,908
Sq Ft
$393/Sq Ft
Est. Value
About This Home
This home is located at 1060 W 600 N, West Bountiful, UT 84087 and is currently estimated at $750,576, approximately $393 per square foot. 1060 W 600 N is a home located in Davis County with nearby schools including West Bountiful Elementary School, Bountiful Junior High School, and Viewmont High School.
Ownership History
Date
Name
Owned For
Owner Type
Purchase Details
Closed on
Nov 3, 2016
Sold by
Turley Gary
Bought by
Turley Trust
Current Estimated Value
Purchase Details
Closed on
Jun 14, 2005
Sold by
Turley Gary and Turley Teri
Bought by
Turley Gary
Home Financials for this Owner
Home Financials are based on the most recent Mortgage that was taken out on this home.
Original Mortgage
$166,500
Interest Rate
5.72%
Mortgage Type
New Conventional
Purchase Details
Closed on
Jun 3, 2005
Sold by
Turley Teri
Bought by
Turley Gary
Home Financials for this Owner
Home Financials are based on the most recent Mortgage that was taken out on this home.
Original Mortgage
$166,500
Interest Rate
5.72%
Mortgage Type
New Conventional
Create a Home Valuation Report for This Property
The Home Valuation Report is an in-depth analysis detailing your home's value as well as a comparison with similar homes in the area
Home Values in the Area
Average Home Value in this Area
Purchase History
| Date | Buyer | Sale Price | Title Company |
|---|---|---|---|
| Turley Trust | -- | -- | |
| Turley Gary | -- | Bonneville Title Company | |
| Turley Gary | -- | Aspen Title Insurance Agency |
Source: Public Records
Mortgage History
| Date | Status | Borrower | Loan Amount |
|---|---|---|---|
| Previous Owner | Turley Gary | $166,500 |
Source: Public Records
Tax History Compared to Growth
Tax History
| Year | Tax Paid | Tax Assessment Tax Assessment Total Assessment is a certain percentage of the fair market value that is determined by local assessors to be the total taxable value of land and additions on the property. | Land | Improvement |
|---|---|---|---|---|
| 2025 | $3,567 | $307,450 | $169,313 | $138,137 |
| 2024 | $3,490 | $309,650 | $140,139 | $169,511 |
| 2023 | $3,327 | $542,000 | $258,686 | $283,314 |
| 2022 | $3,417 | $311,850 | $129,213 | $182,637 |
| 2021 | $3,002 | $419,000 | $184,268 | $234,732 |
| 2020 | $2,598 | $357,000 | $163,117 | $193,883 |
| 2019 | $2,571 | $350,000 | $158,590 | $191,410 |
| 2018 | $2,396 | $321,000 | $149,995 | $171,005 |
| 2016 | $2,064 | $150,315 | $48,283 | $102,032 |
| 2015 | $1,983 | $137,555 | $48,283 | $89,272 |
| 2014 | $1,719 | $122,453 | $48,670 | $73,783 |
| 2013 | -- | $101,386 | $39,348 | $62,038 |
Source: Public Records
Map
Nearby Homes
- 280 N 1100 W
- 767 W 220 N
- Carson Plan at Amberly Place
- 2050 Farmhouse Plan at Amberly Place
- Pasadena Plan at Amberly Place
- Portland Plan at Amberly Place
- 825 W 1320 N
- 1084 W Audrey Ln Unit 20
- 1084 W Audrey Ln
- 680 W 500 S Unit 22
- 680 W 500 S Unit 17
- 1075 W Audrey Ln Unit 6
- 340 N 500 W Unit 204
- 1067 W Audrey Ln Unit 8
- 790 N 500 W
- Swiss 2 - Urban Plan at The Audrey - theAUDREY
- Swiss 3 - Urban Plan at The Audrey - theAUDREY
- Swiss 1 - Cottage Plan at The Audrey - theAUDREY
- Swiss 4 - Cottage Plan at The Audrey - theAUDREY
- Swiss 2 - Cottage Plan at The Audrey - theAUDREY