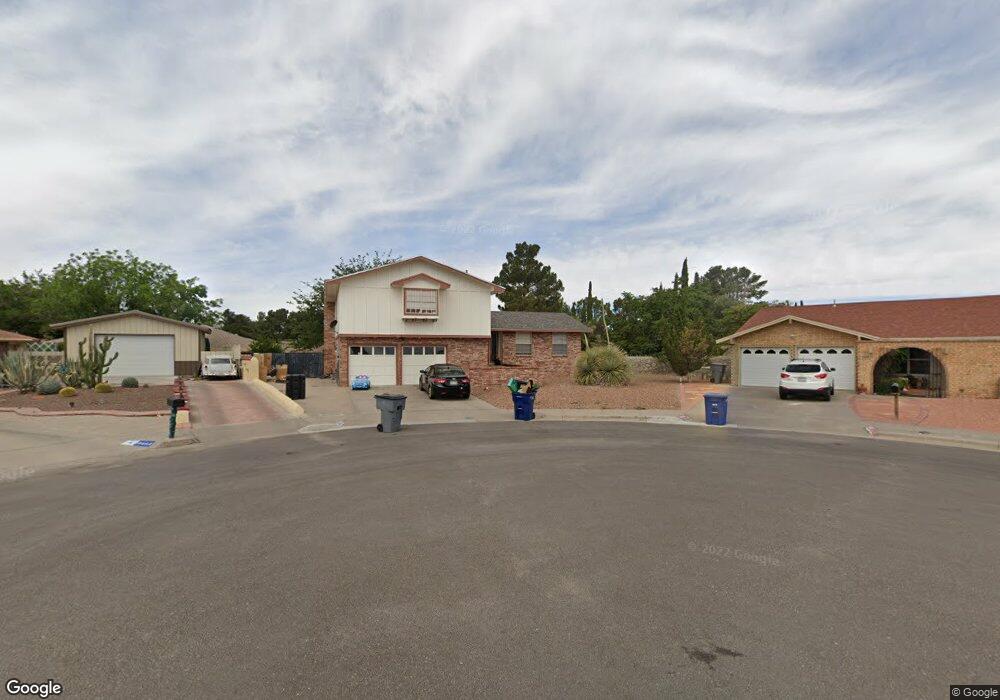
10600 Mary Megan Ct Unit 15 El Paso, TX 79935
Vista Del Sol NeighborhoodEstimated Value: $285,000 - $303,599
3
Beds
3
Baths
2,301
Sq Ft
$129/Sq Ft
Est. Value
About This Home
This home is located at 10600 Mary Megan Ct Unit 15, El Paso, TX 79935 and is currently estimated at $296,650, approximately $128 per square foot. 10600 Mary Megan Ct Unit 15 is a home located in El Paso County with nearby schools including Eastwood Heights Elementary School, Eastwood Middle School, and Eastwood High School.
Ownership History
Date
Name
Owned For
Owner Type
Purchase Details
Closed on
Mar 6, 2017
Sold by
Silva Dan A
Bought by
Silva Dan A
Current Estimated Value
Home Financials for this Owner
Home Financials are based on the most recent Mortgage that was taken out on this home.
Original Mortgage
$132,866
Outstanding Balance
$110,241
Interest Rate
4.19%
Mortgage Type
New Conventional
Estimated Equity
$186,409
Purchase Details
Closed on
Feb 10, 1997
Sold by
Silva Elvira R
Bought by
Silva Dan A
Home Financials for this Owner
Home Financials are based on the most recent Mortgage that was taken out on this home.
Original Mortgage
$15,000
Interest Rate
7.92%
Mortgage Type
Seller Take Back
Purchase Details
Closed on
May 26, 1995
Sold by
Ricketts Zara Massengale and Massengale Zara
Bought by
Silva Dan
Purchase Details
Closed on
Jun 8, 1988
Sold by
Trien John H
Bought by
Silva Dan and Silva Maria Lourdes
Create a Home Valuation Report for This Property
The Home Valuation Report is an in-depth analysis detailing your home's value as well as a comparison with similar homes in the area
Home Values in the Area
Average Home Value in this Area
Purchase History
| Date | Buyer | Sale Price | Title Company |
|---|---|---|---|
| Silva Dan A | -- | Texas Division Of Advantage | |
| Silva Dan A | -- | -- | |
| Silva Dan A | -- | -- | |
| Silva Dan | -- | -- | |
| Silva Dan | -- | -- |
Source: Public Records
Mortgage History
| Date | Status | Borrower | Loan Amount |
|---|---|---|---|
| Open | Silva Dan A | $132,866 | |
| Closed | Silva Dan A | $15,000 |
Source: Public Records
Tax History Compared to Growth
Tax History
| Year | Tax Paid | Tax Assessment Tax Assessment Total Assessment is a certain percentage of the fair market value that is determined by local assessors to be the total taxable value of land and additions on the property. | Land | Improvement |
|---|---|---|---|---|
| 2025 | $7,337 | $280,636 | $49,676 | $230,960 |
| 2024 | $7,337 | $267,118 | $36,158 | $230,960 |
| 2023 | $7,337 | $258,719 | $36,158 | $222,561 |
| 2022 | $7,517 | $242,062 | $36,158 | $205,904 |
| 2021 | $6,386 | $196,467 | $36,158 | $160,309 |
| 2020 | $5,853 | $185,320 | $29,205 | $156,115 |
| 2018 | $5,646 | $181,564 | $29,205 | $152,359 |
| 2017 | $5,227 | $171,005 | $29,205 | $141,800 |
| 2016 | $5,227 | $171,005 | $29,205 | $141,800 |
| 2015 | $4,927 | $171,005 | $29,205 | $141,800 |
| 2014 | $4,927 | $172,198 | $29,205 | $142,993 |
Source: Public Records
Map
Nearby Homes
- 1909 Crow Dr
- 2105 Pacheco Dr
- 10313 Byway Dr
- 2109 Febrero Dr
- 1730 Bara Dr
- 10233 Byway Dr
- 10533 Springwood Dr
- 2224 Escarpa Dr
- 1644 Lomaland Dr Unit 169
- 10304 Woodruff Ct
- 10309 Woodruff Ct
- 2153 Trawood Dr
- 2000 Solano Dr
- 2201 Trawood Dr
- 1649 Lomaland Dr
- 10463 Davwood Ln
- 10512 Album Ave
- 2412 Penwood Dr
- 1844 Jack Nicklaus Dr Unit 1846
- 10481 Deepwood Ct
- 10601 Mary Megan Ct
- 1808 Julia May Place
- 10602 Mary Megan Ct
- 1812 Julia May Place
- 1804 Julia May Place
- 10606 Mary Megan Ct
- 10670 Janway Dr
- 10605 Mary Megan Ct
- 1816 Julia May Place
- 10674 Janway Dr
- 1800 Julia May Place
- 1805 Vista Real Dr
- 1733 Vista Real Dr
- 1801 Vista Real Dr
- 1809 Vista Real Dr
- 1813 Julia May Place
- 1809 Julia May Place
- 10678 Janway Dr
- 1729 Vista Real Dr
- 1741 Vista Real Dr