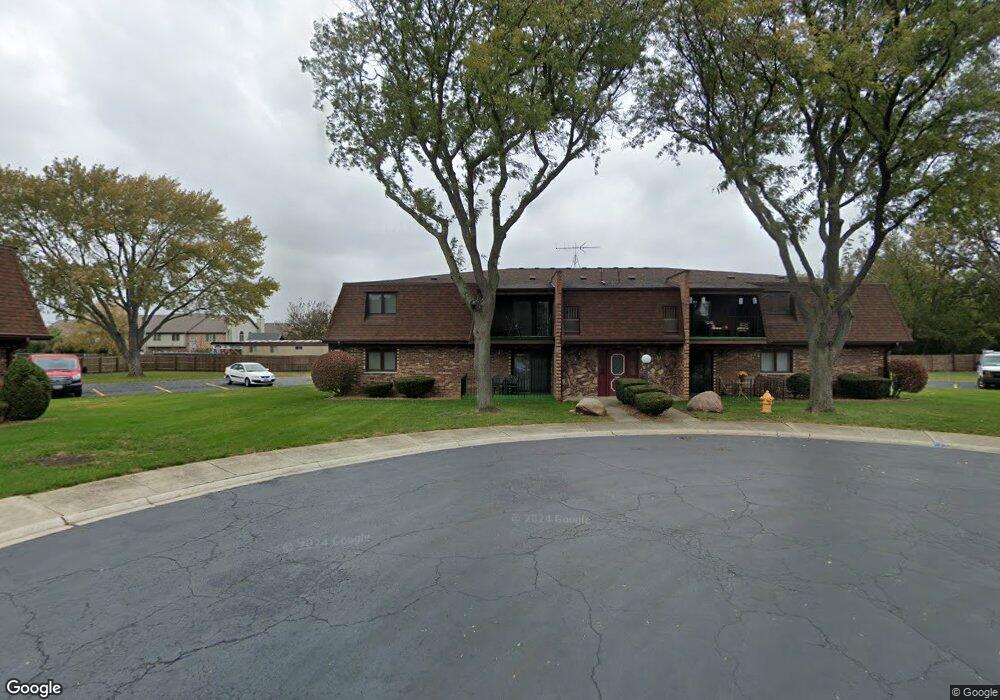
10600 S Brooklodge Ln Unit 3 Palos Hills, IL 60465
Estimated Value: $187,278 - $236,000
2
Beds
2
Baths
990
Sq Ft
$222/Sq Ft
Est. Value
About This Home
This home is located at 10600 S Brooklodge Ln Unit 3, Palos Hills, IL 60465 and is currently estimated at $219,320, approximately $221 per square foot. 10600 S Brooklodge Ln Unit 3 is a home located in Cook County with nearby schools including Sorrick Elementary School, Oak Ridge Elementary School, and H H Conrady Jr High School.
Ownership History
Date
Name
Owned For
Owner Type
Purchase Details
Closed on
Jun 29, 2016
Sold by
Davitt Ramute Ula and The Maria Kelleher 2010 Trust
Bought by
Moczarny Mateusz and Moczarny Kamil
Current Estimated Value
Home Financials for this Owner
Home Financials are based on the most recent Mortgage that was taken out on this home.
Original Mortgage
$91,125
Outstanding Balance
$57,368
Interest Rate
3.62%
Mortgage Type
New Conventional
Estimated Equity
$161,952
Purchase Details
Closed on
Aug 11, 2010
Sold by
Juskiene Marija and Kelleher Maria
Bought by
Kelleher Maria and The Maria Kelleher 2010 Trust
Purchase Details
Closed on
Aug 8, 2000
Sold by
Standard Bk & Tr Company Of Hickory Hills
Bought by
Juskiene Marija
Home Financials for this Owner
Home Financials are based on the most recent Mortgage that was taken out on this home.
Original Mortgage
$95,000
Interest Rate
8.15%
Mortgage Type
Stand Alone First
Create a Home Valuation Report for This Property
The Home Valuation Report is an in-depth analysis detailing your home's value as well as a comparison with similar homes in the area
Home Values in the Area
Average Home Value in this Area
Purchase History
| Date | Buyer | Sale Price | Title Company |
|---|---|---|---|
| Moczarny Mateusz | $121,500 | Old Republic Title | |
| Kelleher Maria | -- | None Available | |
| Juskiene Marija | $96,000 | Professional National Title |
Source: Public Records
Mortgage History
| Date | Status | Borrower | Loan Amount |
|---|---|---|---|
| Open | Moczarny Mateusz | $91,125 | |
| Previous Owner | Juskiene Marija | $95,000 |
Source: Public Records
Tax History Compared to Growth
Tax History
| Year | Tax Paid | Tax Assessment Tax Assessment Total Assessment is a certain percentage of the fair market value that is determined by local assessors to be the total taxable value of land and additions on the property. | Land | Improvement |
|---|---|---|---|---|
| 2024 | $3,289 | $14,700 | $2,975 | $11,725 |
| 2023 | -- | $14,700 | $2,975 | $11,725 |
| 2022 | $0 | $11,076 | $3,455 | $7,621 |
| 2021 | $2,150 | $11,076 | $3,455 | $7,621 |
| 2020 | $2,223 | $11,076 | $3,455 | $7,621 |
| 2019 | $2,203 | $9,820 | $3,167 | $6,653 |
| 2018 | $1,549 | $9,820 | $3,167 | $6,653 |
| 2017 | $1,523 | $9,820 | $3,167 | $6,653 |
| 2016 | $1,286 | $8,004 | $2,783 | $5,221 |
| 2015 | $1,833 | $8,004 | $2,783 | $5,221 |
| 2014 | $1,818 | $8,004 | $2,783 | $5,221 |
| 2013 | $2,673 | $11,157 | $2,783 | $8,374 |
Source: Public Records
Map
Nearby Homes
- 10531 S Roberts Rd Unit 2D
- 10820 Kathleen Ct Unit D
- 10926 Circle Ct
- 10324 S 81st Ave
- 10927 Circle Dr
- 8057 Valley Dr
- 10440 S 75th Ct
- 10441 S 83rd Ave
- 10300 S Kathy Ct
- 11050 S Roberts Rd
- 7810 W 102nd St
- 11001 Stony Creek Dr Unit 2C
- 10226 S 81st Ave
- 3 Stony Creek Dr Unit A
- 10562 S 84th Ave
- 7801 W 111th St
- 10845 S 84th Ave Unit 2A
- 10845 S 84th Ave Unit 2B
- 6 W Pebble Ct Unit A
- 7849 W 101st St
- 10600 S Brooklodge Ln Unit 2C
- 10600 S Brooklodge Ln Unit 3
- 10600 S Brooklodge Ln Unit 3
- 10600 S Brooklodge Ln Unit 3
- 10600 S Brooklodge Ln Unit 3
- 10600 S Brooklodge Ln Unit 3
- 10600 S Brooklodge Ln Unit 2A
- 10600 S Brooklodge Ln Unit 1B
- 10600 S Brooklodge Ln Unit 2D
- 10600 S Brooklodge Ln Unit 3-2A
- 10600 S Brooklodge Ln Unit 1A
- 10630 S Brooklodge Ln Unit 2C
- 10630 S Brooklodge Ln Unit 4
- 10630 S Brooklodge Ln Unit 4
- 10630 S Brooklodge Ln Unit 4
- 10630 S Brooklodge Ln Unit 4
- 10630 S Brooklodge Ln Unit 4
- 10630 S Brooklodge Ln Unit 4
- 10630 S Brooklodge Ln Unit 2A
- 10630 S Brooklodge Ln Unit 2B