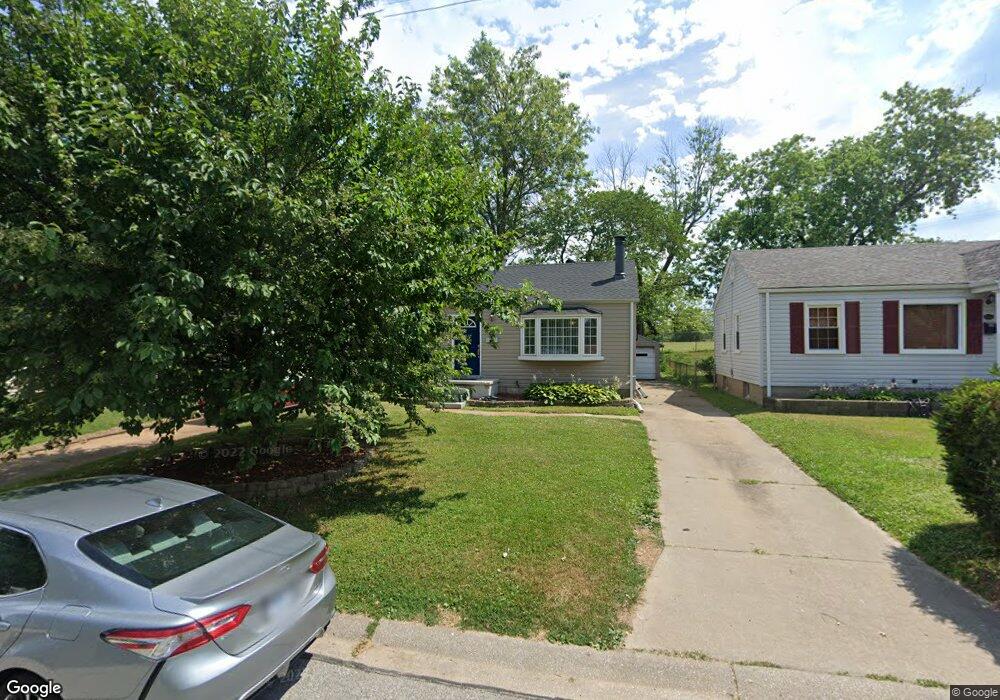
10600 Saint Francis Ln Saint Ann, MO 63074
Estimated Value: $127,766 - $156,000
2
Beds
1
Bath
792
Sq Ft
$181/Sq Ft
Est. Value
About This Home
This home is located at 10600 Saint Francis Ln, Saint Ann, MO 63074 and is currently estimated at $143,442, approximately $181 per square foot. 10600 Saint Francis Ln is a home located in St. Louis County with nearby schools including Buder Elementary School, Hoech Middle School, and Ritenour Senior High School.
Ownership History
Date
Name
Owned For
Owner Type
Purchase Details
Closed on
Oct 27, 2005
Sold by
Meyer Norvel and Meyer Kara M
Bought by
Belding Joel W and Belding Jean F
Current Estimated Value
Home Financials for this Owner
Home Financials are based on the most recent Mortgage that was taken out on this home.
Original Mortgage
$110,000
Outstanding Balance
$58,766
Interest Rate
5.73%
Mortgage Type
Fannie Mae Freddie Mac
Estimated Equity
$84,676
Purchase Details
Closed on
Nov 7, 1997
Sold by
Granzow Irene E
Bought by
Meyer Norvel and Meyer Kara M
Home Financials for this Owner
Home Financials are based on the most recent Mortgage that was taken out on this home.
Original Mortgage
$61,963
Interest Rate
7.28%
Mortgage Type
FHA
Purchase Details
Closed on
Sep 17, 1997
Sold by
Beasley Mary Ann Granzow and Granzow Mary Ann
Bought by
Granzow Irene E
Home Financials for this Owner
Home Financials are based on the most recent Mortgage that was taken out on this home.
Original Mortgage
$61,963
Interest Rate
7.28%
Mortgage Type
FHA
Create a Home Valuation Report for This Property
The Home Valuation Report is an in-depth analysis detailing your home's value as well as a comparison with similar homes in the area
Home Values in the Area
Average Home Value in this Area
Purchase History
| Date | Buyer | Sale Price | Title Company |
|---|---|---|---|
| Belding Joel W | $110,000 | -- | |
| Meyer Norvel | -- | -- | |
| Granzow Irene E | -- | -- |
Source: Public Records
Mortgage History
| Date | Status | Borrower | Loan Amount |
|---|---|---|---|
| Open | Belding Joel W | $110,000 | |
| Previous Owner | Meyer Norvel | $61,963 | |
| Closed | Meyer Norvel | $2,000 |
Source: Public Records
Tax History Compared to Growth
Tax History
| Year | Tax Paid | Tax Assessment Tax Assessment Total Assessment is a certain percentage of the fair market value that is determined by local assessors to be the total taxable value of land and additions on the property. | Land | Improvement |
|---|---|---|---|---|
| 2025 | $2,099 | $27,360 | $4,960 | $22,400 |
| 2024 | $2,099 | $21,340 | $4,240 | $17,100 |
| 2023 | $2,038 | $21,340 | $4,240 | $17,100 |
| 2022 | $1,782 | $17,050 | $3,690 | $13,360 |
| 2021 | $1,781 | $17,050 | $3,690 | $13,360 |
| 2020 | $1,576 | $13,810 | $3,250 | $10,560 |
| 2019 | $1,559 | $13,810 | $3,250 | $10,560 |
| 2018 | $1,536 | $12,240 | $3,100 | $9,140 |
| 2017 | $1,453 | $12,240 | $3,100 | $9,140 |
| 2016 | $1,351 | $12,410 | $3,100 | $9,310 |
| 2015 | $1,382 | $12,410 | $3,100 | $9,310 |
| 2014 | $1,461 | $13,360 | $1,920 | $11,440 |
Source: Public Records
Map
Nearby Homes
- 10762 Saint Dismas Ct
- 3442 Saint Donald Ln
- 10583 Mert Ave
- 10300 Saint Katherine Ln
- 3446 Saint Clovis Ln
- 10525 Hobday Ave
- 3365 Marmary Ln
- 10325 Breckenridge Rd
- 10225 Saint Katherine Ln
- 3327 Krem Ct
- 3217 Krem Ave
- 3529 Saint Joachim Ln
- 3548 Saint Genevieve Ln
- 3134 O Hare Dr
- 3519 High Dr
- 10300 Breckenridge Rd
- 10307 Saint Arthur Ln
- 10810 Hobday Ave
- 3604 San Jose Ln
- 10335 Saint Joan Ln
- 10604 Saint Francis Ln
- 10524 Saint Francis Ln
- 10520 Saint Francis Ln
- 10608 Saint Francis Ln
- 10612 Saint Francis Ln
- 10516 Saint Francis Ln
- 3401 Saint Ignatius Ln
- 10512 Saint Francis Ln
- 10616 Saint Francis Ln
- 10517 Saint Francis Ln
- 10607 Saint Francis Ln
- 10611 Saint Francis Ln
- 10620 Saint Francis Ln
- 10508 Saint Francis Ln
- 10513 Saint Francis Ln
- 3409 Saint Ignatius Ln
- 3400 Saint Martin Ln
- 3408 Saint Ignatius Ln
- 10624 Saint Francis Ln
- 10504 Saint Francis Ln