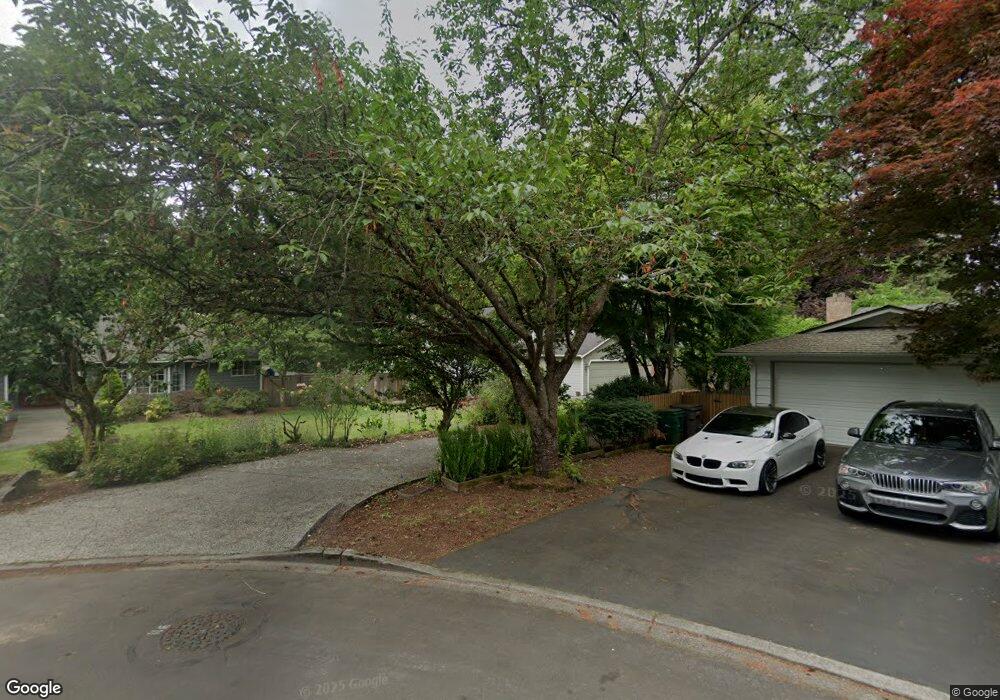
10601 NE 143rd St Bothell, WA 98011
Norway Hill NeighborhoodEstimated Value: $1,309,000 - $1,370,000
4
Beds
3
Baths
2,010
Sq Ft
$666/Sq Ft
Est. Value
About This Home
This home is located at 10601 NE 143rd St, Bothell, WA 98011 and is currently estimated at $1,339,662, approximately $666 per square foot. 10601 NE 143rd St is a home located in King County with nearby schools including Moorlands Elementary School, Northshore Junior High School, and Inglemoor High School.
Ownership History
Date
Name
Owned For
Owner Type
Purchase Details
Closed on
Aug 31, 2021
Sold by
Cooper Charles and Cooper Emily
Bought by
Oh Jinoh and Lee Jeongmee
Current Estimated Value
Home Financials for this Owner
Home Financials are based on the most recent Mortgage that was taken out on this home.
Original Mortgage
$968,000
Outstanding Balance
$873,409
Interest Rate
2.25%
Mortgage Type
New Conventional
Estimated Equity
$466,253
Purchase Details
Closed on
Jul 24, 2009
Sold by
Baker R Brian and Baker Franca A
Bought by
Cooper Charles and Cooper Emily
Home Financials for this Owner
Home Financials are based on the most recent Mortgage that was taken out on this home.
Original Mortgage
$402,573
Interest Rate
5.17%
Mortgage Type
FHA
Purchase Details
Closed on
Jul 29, 1991
Sold by
Mia Construction Inc
Bought by
Baker Baker R and Baker Franca A
Create a Home Valuation Report for This Property
The Home Valuation Report is an in-depth analysis detailing your home's value as well as a comparison with similar homes in the area
Home Values in the Area
Average Home Value in this Area
Purchase History
| Date | Buyer | Sale Price | Title Company |
|---|---|---|---|
| Oh Jinoh | $1,210,000 | Cw Title | |
| Cooper Charles | $410,000 | Ticor National | |
| Baker Baker R | $182,800 | -- |
Source: Public Records
Mortgage History
| Date | Status | Borrower | Loan Amount |
|---|---|---|---|
| Open | Oh Jinoh | $968,000 | |
| Previous Owner | Cooper Charles | $402,573 |
Source: Public Records
Tax History
| Year | Tax Paid | Tax Assessment Tax Assessment Total Assessment is a certain percentage of the fair market value that is determined by local assessors to be the total taxable value of land and additions on the property. | Land | Improvement |
|---|---|---|---|---|
| 2024 | $9,495 | $1,158,000 | $891,000 | $267,000 |
| 2023 | $8,925 | $953,000 | $433,000 | $520,000 |
| 2022 | $7,681 | $1,170,000 | $456,000 | $714,000 |
| 2021 | $6,936 | $853,000 | $335,000 | $518,000 |
| 2020 | $6,680 | $702,000 | $277,000 | $425,000 |
| 2018 | $5,956 | $710,000 | $270,000 | $440,000 |
| 2017 | $5,097 | $573,000 | $187,000 | $386,000 |
| 2016 | $4,860 | $509,000 | $168,000 | $341,000 |
| 2015 | $4,388 | $478,000 | $158,000 | $320,000 |
| 2014 | -- | $414,000 | $140,000 | $274,000 |
| 2013 | -- | $366,000 | $124,000 | $242,000 |
Source: Public Records
Map
Nearby Homes
- 10554 NE 150th Ct
- 10623 NE 155th Place
- 14812 107th Ave NE
- 10901 NE 151st St
- 10822 NE 148th Ln Unit J102
- 14433 106th Place NE
- 15732 111th Ave NE
- 11226 NE 145th St
- 9911 NE 158th St
- 14260 110th Ave NE
- 145 Xxx 100th Ave NE
- 16454 108th Ave NE
- 9930 NE 144th Ln Unit 202
- 16414 104th Ave NE
- 9926 NE 144th Ln Unit 301
- 15615 Waynita Way NE Unit B-303
- 15700 116th Ave NE Unit 102
- 15700 116th Ave NE Unit A204
- 15903 98th Ave NE
- 15805 Waynita Way NE Unit D107
- 10601 NE 153rd St
- 10601 NE 152nd St
- 10609 NE 153rd St
- 10531 NE 152nd St
- 10550 NE 150th Ct
- 10525 NE 152nd St
- 10617 NE 153rd St
- 10532 NE 152nd St
- 10551 NE 150th Ct
- 10606 NE 153rd St
- 15302 106th Ave NE
- 10522 NE 152nd St
- 10616 NE 153rd St
- 10519 NE 152nd St
- 10625 NE 153rd St
- 10560 NE 150th Ct
- 15021 106th Ave NE
- 15312 106th Ave NE
- 10555 NE 150th Ct
- 10512 NE 152nd St
Your Personal Tour Guide
Ask me questions while you tour the home.