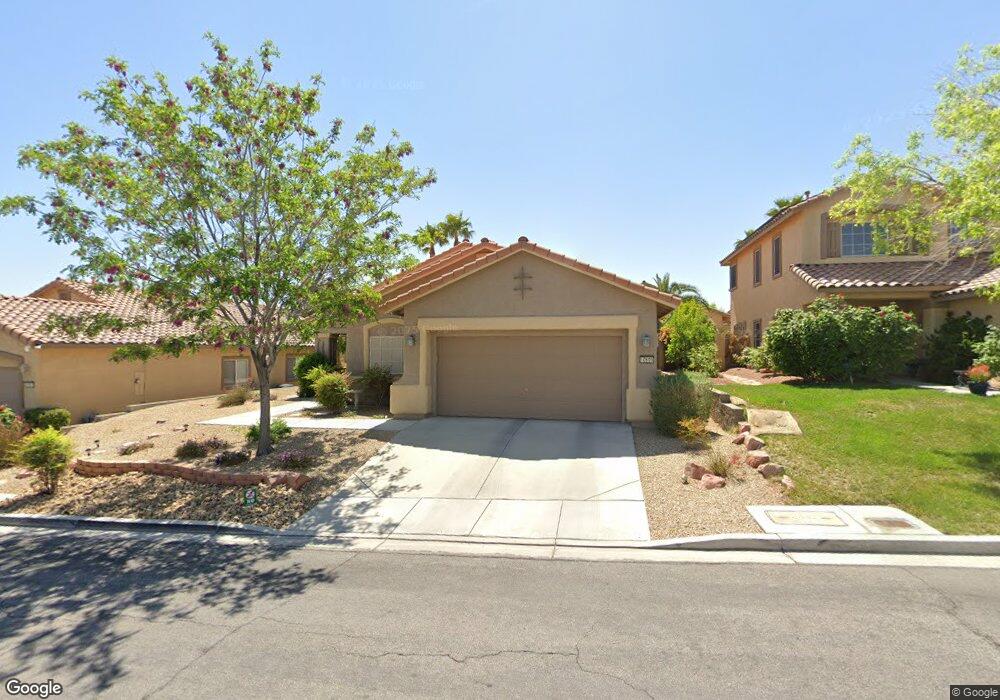
10605 Umbrella Tree Ct Las Vegas, NV 89144
Summerlin NeighborhoodEstimated Value: $528,000 - $553,000
3
Beds
2
Baths
1,751
Sq Ft
$309/Sq Ft
Est. Value
About This Home
This home is located at 10605 Umbrella Tree Ct, Las Vegas, NV 89144 and is currently estimated at $540,795, approximately $308 per square foot. 10605 Umbrella Tree Ct is a home located in Clark County with nearby schools including John W. Bonner Elementary School, Sig Rogich Middle School, and Palo Verde High School.
Ownership History
Date
Name
Owned For
Owner Type
Purchase Details
Closed on
Oct 8, 2002
Sold by
Feltman Todd
Bought by
Feltman Judith Y
Current Estimated Value
Home Financials for this Owner
Home Financials are based on the most recent Mortgage that was taken out on this home.
Original Mortgage
$192,753
Outstanding Balance
$80,396
Interest Rate
6.09%
Mortgage Type
VA
Estimated Equity
$460,399
Purchase Details
Closed on
Oct 7, 2002
Sold by
Feltman Judith Y and Lin Judith Y
Bought by
Hansen Troy C and Hansen Loretta E
Home Financials for this Owner
Home Financials are based on the most recent Mortgage that was taken out on this home.
Original Mortgage
$192,753
Outstanding Balance
$80,396
Interest Rate
6.09%
Mortgage Type
VA
Estimated Equity
$460,399
Purchase Details
Closed on
Jun 22, 1999
Sold by
The Presley Homes
Bought by
Lin Judith Y
Home Financials for this Owner
Home Financials are based on the most recent Mortgage that was taken out on this home.
Original Mortgage
$150,200
Interest Rate
7.05%
Create a Home Valuation Report for This Property
The Home Valuation Report is an in-depth analysis detailing your home's value as well as a comparison with similar homes in the area
Home Values in the Area
Average Home Value in this Area
Purchase History
| Date | Buyer | Sale Price | Title Company |
|---|---|---|---|
| Feltman Judith Y | -- | Fidelity National Title | |
| Hansen Troy C | $199,900 | Fidelity National Title | |
| Lin Judith Y | $155,000 | First American Title Co |
Source: Public Records
Mortgage History
| Date | Status | Borrower | Loan Amount |
|---|---|---|---|
| Open | Hansen Troy C | $192,753 | |
| Previous Owner | Lin Judith Y | $150,200 |
Source: Public Records
Tax History Compared to Growth
Tax History
| Year | Tax Paid | Tax Assessment Tax Assessment Total Assessment is a certain percentage of the fair market value that is determined by local assessors to be the total taxable value of land and additions on the property. | Land | Improvement |
|---|---|---|---|---|
| 2025 | $2,591 | $128,063 | $59,850 | $68,213 |
| 2024 | $2,516 | $128,063 | $59,850 | $68,213 |
| 2023 | $2,516 | $110,212 | $45,500 | $64,712 |
| 2022 | $2,443 | $97,246 | $38,150 | $59,096 |
| 2021 | $2,372 | $92,358 | $36,050 | $56,308 |
| 2020 | $2,382 | $87,644 | $31,850 | $55,794 |
| 2019 | $2,233 | $85,843 | $30,800 | $55,043 |
| 2018 | $2,091 | $74,975 | $23,100 | $51,875 |
| 2017 | $2,435 | $74,095 | $21,700 | $52,395 |
| 2016 | $1,906 | $71,873 | $19,250 | $52,623 |
| 2015 | $1,954 | $65,968 | $14,000 | $51,968 |
| 2014 | $1,897 | $55,922 | $11,025 | $44,897 |
Source: Public Records
Map
Nearby Homes
- 10600 Olivebranch Ave
- 10645 Redwood Grove Ave
- 916 Autumn Royal Ln
- 10501 Pacific Palisades Ave
- 10400 Beachwalk Place
- 1201 Mersault Ct
- 1316 Pintail Point St
- 10432 American Falls Ln
- 10616 Englewood Cliffs Ave
- 552 Jade Cliffs Ln
- 10657 Blue Nile Ct
- 1204 Moselle Ct
- 10665 Blue Nile Ct
- 10673 Blue Nile Ct
- 1024 Eaglewood Dr
- 10680 Sapphire Vista Ave
- 812 Eaglewood Dr
- 901 Cambridge Cross Place
- 10661 Sapphire Vista Ave
- 10665 Sapphire Vista Ave
- 10609 Umbrella Tree Ct
- 10601 Umbrella Tree Ct
- 10608 Royal Willow Place
- 10613 Umbrella Tree Ct
- 10612 Royal Willow Place
- 10600 Royal Willow Place
- 10604 Umbrella Tree Ct
- 10600 Umbrella Tree Ct
- 10600 Umbrella Tree Ct Unit n
- 10600 Umbrella Tree Ct Unit none
- 10608 Umbrella Tree Ct Unit 3
- 10612 Umbrella Tree Ct
- 924 Royal Plum Ln
- 10617 Umbrella Tree Ct
- 10616 Royal Willow Place Unit 2
- 1000 Royal Plum Ln
- 916 Royal Plum Ln
- 10616 Umbrella Tree Ct
- 904 Royal Elm Ln
- 912 Royal Plum Ln