1061 Arthur Nuburn Jr Rd Brooklet, GA 30415
Estimated Value: $221,109 - $314,000
3
Beds
3
Baths
952
Sq Ft
$277/Sq Ft
Est. Value
About This Home
This home is located at 1061 Arthur Nuburn Jr Rd, Brooklet, GA 30415 and is currently estimated at $263,777, approximately $277 per square foot. 1061 Arthur Nuburn Jr Rd is a home located in Bulloch County with nearby schools including Nevils Elementary School, Southeast Bulloch High School, and Southeast Bulloch Middle School.
Ownership History
Date
Name
Owned For
Owner Type
Purchase Details
Closed on
Oct 15, 2018
Sold by
Coto Clifton W
Bought by
Coto Tammy B
Current Estimated Value
Purchase Details
Closed on
Jul 3, 2018
Sold by
Coto Mary C
Bought by
Coto Clifton W
Purchase Details
Closed on
Aug 12, 2005
Sold by
Baxley Stuart L
Bought by
Coto Clifton and Coto Mary C
Home Financials for this Owner
Home Financials are based on the most recent Mortgage that was taken out on this home.
Original Mortgage
$113,018
Interest Rate
5.61%
Mortgage Type
New Conventional
Purchase Details
Closed on
Nov 1, 2004
Bought by
Baxley Stuart L
Purchase Details
Closed on
Mar 1, 2002
Bought by
Allen Pam J
Purchase Details
Closed on
Jun 1, 1993
Bought by
Allen Ricky
Create a Home Valuation Report for This Property
The Home Valuation Report is an in-depth analysis detailing your home's value as well as a comparison with similar homes in the area
Home Values in the Area
Average Home Value in this Area
Purchase History
| Date | Buyer | Sale Price | Title Company |
|---|---|---|---|
| Coto Tammy B | -- | -- | |
| Coto Clifton W | -- | -- | |
| Coto Clifton | $140,800 | -- | |
| Baxley Stuart L | -- | -- | |
| Allen Pam J | -- | -- | |
| Allen Ricky | -- | -- |
Source: Public Records
Mortgage History
| Date | Status | Borrower | Loan Amount |
|---|---|---|---|
| Previous Owner | Coto Clifton | $113,018 |
Source: Public Records
Tax History Compared to Growth
Tax History
| Year | Tax Paid | Tax Assessment Tax Assessment Total Assessment is a certain percentage of the fair market value that is determined by local assessors to be the total taxable value of land and additions on the property. | Land | Improvement |
|---|---|---|---|---|
| 2024 | $1,314 | $58,960 | $6,880 | $52,080 |
| 2023 | $1,398 | $57,480 | $5,480 | $52,000 |
| 2022 | $1,087 | $50,370 | $4,594 | $45,776 |
| 2021 | $986 | $44,554 | $4,594 | $39,960 |
| 2020 | $952 | $41,879 | $3,828 | $38,051 |
| 2019 | $814 | $42,014 | $3,828 | $38,186 |
| 2018 | $847 | $38,490 | $3,189 | $35,301 |
| 2017 | $843 | $37,857 | $3,189 | $34,668 |
| 2016 | $799 | $34,970 | $3,189 | $31,781 |
| 2015 | $813 | $35,474 | $3,189 | $32,285 |
| 2014 | $751 | $35,474 | $3,189 | $32,285 |
Source: Public Records
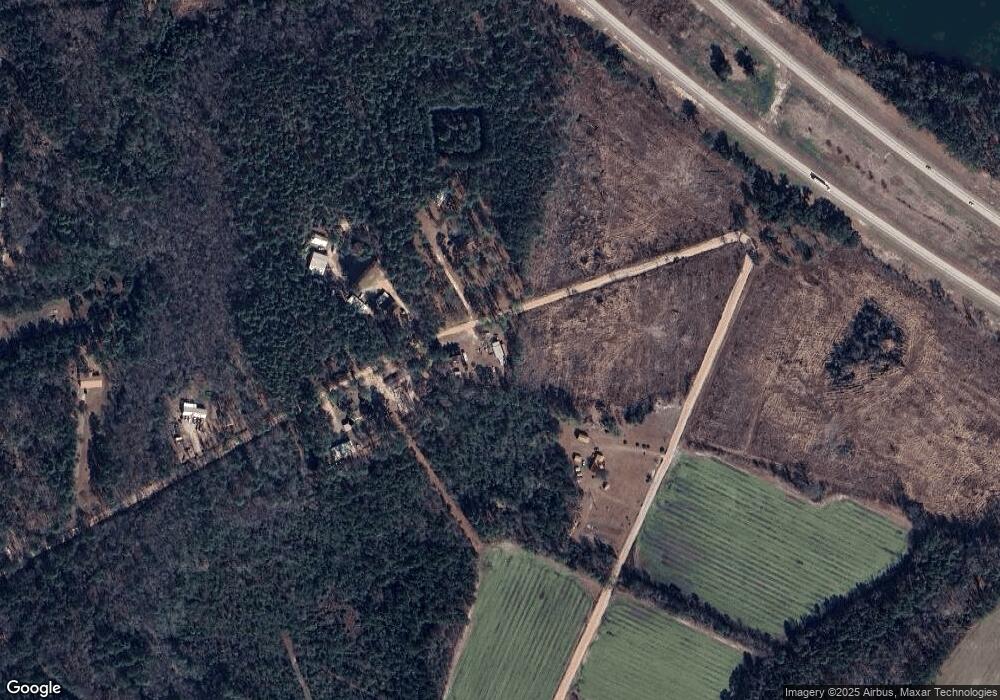
Map
Nearby Homes
- 1278 Arthur Nuburn Rd
- 1278 Arthur Nuburn Jr Rd
- 5298 Ga Highway 67
- 1014 Iler Rd
- 3309 Georgia 67
- 3309 Ga Highway 67
- 883 Old Happy Rd
- 4931 Mill Branch Hunting Club Rd
- HWY 46 Georgia 46
- 5185 Old Groveland Rd
- 4493 Lawrence Church Rd
- 19963 Ga Highway 46
- 545 Live Oak Ln
- 0 R P Miller Rd
- 0 Ash Branch Church Rd Unit 10624042
- 2784 Brooklet Denmark Rd
- 3193 Old Groveland Rd
- 0 Peppercorn Trail Unit SA335417
- 0 Black Creek Church Rd Unit 22629943
- 288 Arcola Rd
- 1106 Arthur Nuburn Jr Rd
- 1089 Arthur Nuburn Jr Rd
- 1042 Arthur Nuburn Jr Rd
- 1151 Arthur Nuburn Jr Rd
- 5212 Ga Highway 67
- 5212 Georgia 67
- 4758 Ga Highway 67
- 4742 Ga Highway 67
- 5286 Ga Highway 67
- 5286 Ga Highway 67
- 5044 Ga Highway 67
- 4953 Ga Highway 67
- 300 Paul Smith Rd
- 424 Arthur Nubern Jr Rd
- 4795 Ga Highway 67
- 4795 Ga Highway 67
- 5274 Ga Highway 67
- 4793 Georgia 67
- 251 Paul Smith Rd
- 5059 Ga Highway 67