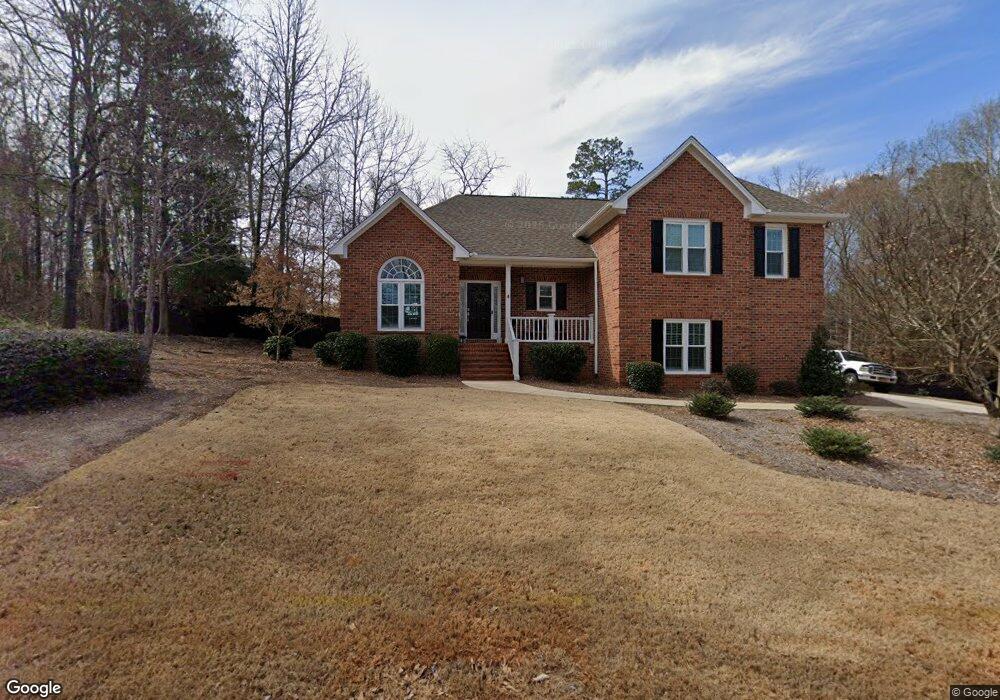
1061 Bent Creek Rd Bogart, GA 30622
Estimated Value: $482,598 - $602,000
3
Beds
4
Baths
1,875
Sq Ft
$282/Sq Ft
Est. Value
About This Home
This home is located at 1061 Bent Creek Rd, Bogart, GA 30622 and is currently estimated at $528,150, approximately $281 per square foot. 1061 Bent Creek Rd is a home located in Oconee County with nearby schools including Rocky Branch Elementary School, Malcom Bridge Middle School, and North Oconee High School.
Ownership History
Date
Name
Owned For
Owner Type
Purchase Details
Closed on
Jun 11, 2021
Sold by
Howard Wendell Ray
Bought by
Owens Travis and Owens Meredith
Current Estimated Value
Purchase Details
Closed on
Dec 24, 2011
Sold by
Howard Wendell Ray
Bought by
Howard Wendell Ray
Purchase Details
Closed on
Dec 10, 2008
Sold by
Wellington Partnership Ltd
Bought by
Howard Wendell Ray
Home Financials for this Owner
Home Financials are based on the most recent Mortgage that was taken out on this home.
Original Mortgage
$120,000
Interest Rate
6.1%
Mortgage Type
New Conventional
Purchase Details
Closed on
Feb 26, 2001
Sold by
Dean Jeffrey F and Dean D
Bought by
Daniels James A and Daniels Carol F
Purchase Details
Closed on
Oct 10, 1996
Sold by
Abraham Glenn M
Bought by
Dean Jeffrey F and Dean D
Purchase Details
Closed on
May 20, 1994
Bought by
Abraham Glenn M
Create a Home Valuation Report for This Property
The Home Valuation Report is an in-depth analysis detailing your home's value as well as a comparison with similar homes in the area
Home Values in the Area
Average Home Value in this Area
Purchase History
| Date | Buyer | Sale Price | Title Company |
|---|---|---|---|
| Owens Travis | $350,000 | -- | |
| Howard Wendell Ray | -- | -- | |
| Howard Wendell Ray | $159,000 | -- | |
| Daniels James A | $219,500 | -- | |
| Dean Jeffrey F | $185,000 | -- | |
| Abraham Glenn M | $168,800 | -- |
Source: Public Records
Mortgage History
| Date | Status | Borrower | Loan Amount |
|---|---|---|---|
| Previous Owner | Howard Wendell Ray | $120,000 |
Source: Public Records
Tax History Compared to Growth
Tax History
| Year | Tax Paid | Tax Assessment Tax Assessment Total Assessment is a certain percentage of the fair market value that is determined by local assessors to be the total taxable value of land and additions on the property. | Land | Improvement |
|---|---|---|---|---|
| 2024 | $3,256 | $176,744 | $30,000 | $146,744 |
| 2023 | $3,305 | $164,952 | $26,000 | $138,952 |
| 2022 | $3,000 | $147,463 | $26,000 | $121,463 |
| 2021 | $2,614 | $113,209 | $24,000 | $89,209 |
| 2020 | $2,521 | $109,013 | $24,000 | $85,013 |
| 2019 | $2,489 | $107,652 | $24,000 | $83,652 |
| 2018 | $2,397 | $101,505 | $24,000 | $77,505 |
| 2017 | $2,212 | $93,701 | $24,000 | $69,701 |
| 2016 | $2,036 | $86,288 | $24,000 | $62,288 |
| 2015 | $2,030 | $85,836 | $24,000 | $61,836 |
| 2014 | $2,063 | $83,309 | $24,000 | $59,309 |
| 2013 | -- | $85,451 | $28,000 | $57,451 |
Source: Public Records
Map
Nearby Homes
- 1061 Bent Creek Rd
- 1120 Lancaster Ct
- 2550 Hodges Mill Rd
- 1190 Wareview Ct
- 2620 Hodges Mill Rd
- 3131 Rocky Branch Rd Unit 140
- 3131 Rocky Branch Rd Unit 280
- 1271 Daandra Dr
- 1336 Prince Place
- 1895 Vintage Place
- 1020 Barber Creek Dr Unit 211
- 0 Mars Hill Rd Unit 1025421
- 0 Mars Hill Rd Unit 10509287
- 1941 Mars Hill Rd
- 1051 Riverhaven Ln
- 1070 Sagefield Dr
- 1031 Sagefield Dr
- 1091 Barber Creek Dr
- 1080 Barber Creek Dr
- 1281 Bent Creek Rd
- 1081 Bent Creek Rd
- 1301 Bent Creek Rd
- 1301 Bent Creek Rd
- 1051 Bent Creek Rd
- 1051 Laurel Pointe
- 1050 Bent Creek Rd
- 1261 Bent Creek Rd
- 1261 Bent Creek Rd
- 1070 Bent Creek Rd
- 1321 Bent Creek Rd
- 1101 Bent Creek Rd
- 1101 Bent Creek Rd
- 1041 Bent Creek Rd
- 1300 Bent Creek Rd
- 1280 Bent Creek Rd
- 1280 Bent Creek Rd
- 1080 Bent Creek Rd
- 1021 Bent Creek Rd
- 1021 Bent Creek Rd