Estimated Value: $465,000 - $517,000
3
Beds
2
Baths
2,184
Sq Ft
$227/Sq Ft
Est. Value
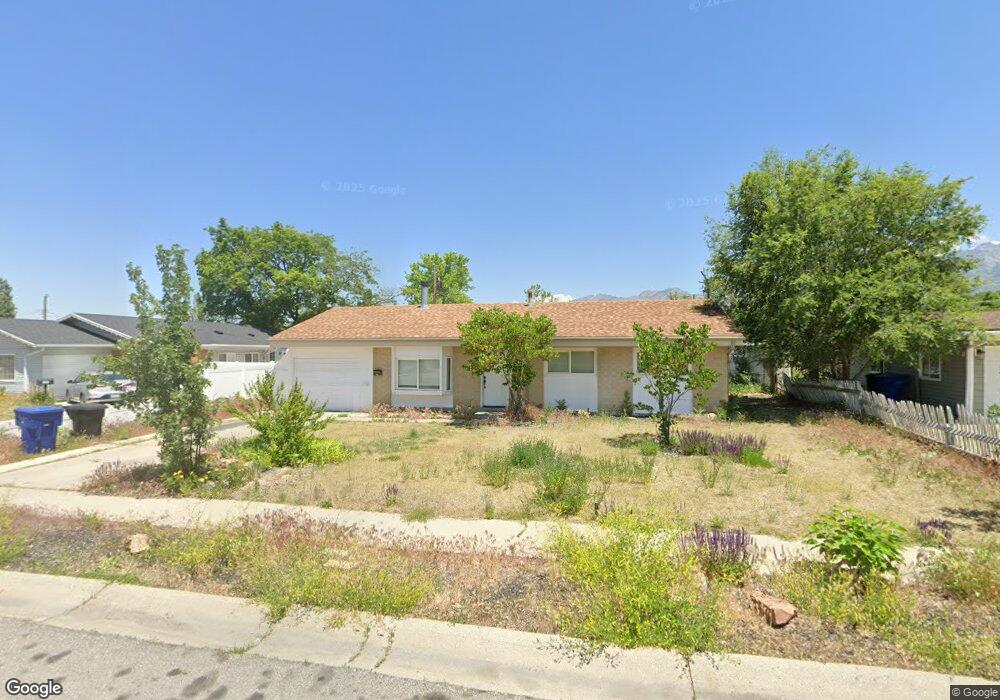
About This Home
This home is located at 1061 E Platinum Way, Sandy, UT 84094 and is currently estimated at $496,139, approximately $227 per square foot. 1061 E Platinum Way is a home located in Salt Lake County with nearby schools including Eastmont Middle School, Jordan High, and Blessed Sacrament Catholic School.
Ownership History
Date
Name
Owned For
Owner Type
Purchase Details
Closed on
Jun 7, 2022
Sold by
Julie Albert
Bought by
Rezaei Foad and Rezaei Farhoud
Current Estimated Value
Home Financials for this Owner
Home Financials are based on the most recent Mortgage that was taken out on this home.
Original Mortgage
$475,000
Outstanding Balance
$448,672
Interest Rate
5.11%
Mortgage Type
New Conventional
Estimated Equity
$47,467
Purchase Details
Closed on
Apr 6, 2022
Sold by
Patty Jarvis
Bought by
Albert Julie and Albert Gary
Purchase Details
Closed on
Sep 26, 2003
Sold by
Fonger Eric T and Fonger Tracy
Bought by
Jarvis Patty
Home Financials for this Owner
Home Financials are based on the most recent Mortgage that was taken out on this home.
Original Mortgage
$111,600
Interest Rate
6.17%
Mortgage Type
Purchase Money Mortgage
Purchase Details
Closed on
Jan 28, 1998
Sold by
Reid Lawrence E and Reid Fred W
Bought by
Calder David D and Calder Candice
Home Financials for this Owner
Home Financials are based on the most recent Mortgage that was taken out on this home.
Original Mortgage
$111,150
Interest Rate
7.05%
Purchase Details
Closed on
Jul 21, 1997
Sold by
Sorensen Vernal Richard and Sorensen Kristine A
Bought by
Reid Lawrence E and Reid Fred W
Create a Home Valuation Report for This Property
The Home Valuation Report is an in-depth analysis detailing your home's value as well as a comparison with similar homes in the area
Home Values in the Area
Average Home Value in this Area
Purchase History
| Date | Buyer | Sale Price | Title Company |
|---|---|---|---|
| Rezaei Foad | -- | New Title Company Name | |
| Albert Julie | -- | Title Guarantee | |
| Albert Julie | -- | Title Guarantee | |
| Jarvis Patty | -- | United Title Services | |
| Calder David D | -- | -- | |
| Reid Lawrence E | -- | -- |
Source: Public Records
Mortgage History
| Date | Status | Borrower | Loan Amount |
|---|---|---|---|
| Open | Rezaei Foad | $475,000 | |
| Previous Owner | Jarvis Patty | $111,600 | |
| Previous Owner | Calder David D | $111,150 |
Source: Public Records
Tax History
| Year | Tax Paid | Tax Assessment Tax Assessment Total Assessment is a certain percentage of the fair market value that is determined by local assessors to be the total taxable value of land and additions on the property. | Land | Improvement |
|---|---|---|---|---|
| 2025 | $3,475 | $471,200 | $121,100 | $350,100 |
| 2024 | $3,475 | $457,200 | $113,200 | $344,000 |
| 2023 | $3,435 | $449,200 | $107,600 | $341,600 |
| 2022 | $2,952 | $427,500 | $105,500 | $322,000 |
| 2021 | $2,667 | $316,600 | $82,000 | $234,600 |
| 2020 | $2,465 | $292,300 | $82,000 | $210,300 |
| 2019 | $2,255 | $265,100 | $77,400 | $187,700 |
| 2016 | $1,746 | $198,700 | $77,400 | $121,300 |
Source: Public Records
Map
Nearby Homes
- 1062 E Diamond Way
- 1123 E Sego Lily Dr
- 9976 Tamara St E
- 941 E Carnation Dr
- 9968 S Blossom Dr
- 954 E Carnation Dr
- 10366 S Larkspur Cir
- 9587 S 1040 E
- 9633 S 1210 E
- 10172 Snow Iris Way
- 10517 S Larkspur Dr
- 1469 Winterwood Cir
- 10351 S Zinnia Way
- 1420 E Firelight Way
- 837 E 10515 S
- 10491 Amaryllis St
- 1119 E 10600 S
- 1563 E Tameron Dr
- 1584 Petunia Way
- 9971 Pinehurst Dr
- 1061 Platinum Way
- 0 Online Business Unit 104100
- 1055 Platinum Way
- 1067 E Platinum Way
- 1055 E Platinum Way
- 1067 Platinum Way
- 1076 Turquoise Way
- 1070 Turquoise Way
- 1070 E Turquoise Way
- 1084 Turquoise Way
- 1047 Platinum Way
- 10024 S Flint Dr
- 10024 Flint Dr
- 1056 Platinum Way
- 1062 Platinum Way
- 1062 E Platinum Way
- 1062 Turquoise Way
- 1050 Platinum Way
- 1050 E Platinum Way
- 1090 Turquoise Way
Your Personal Tour Guide
Ask me questions while you tour the home.