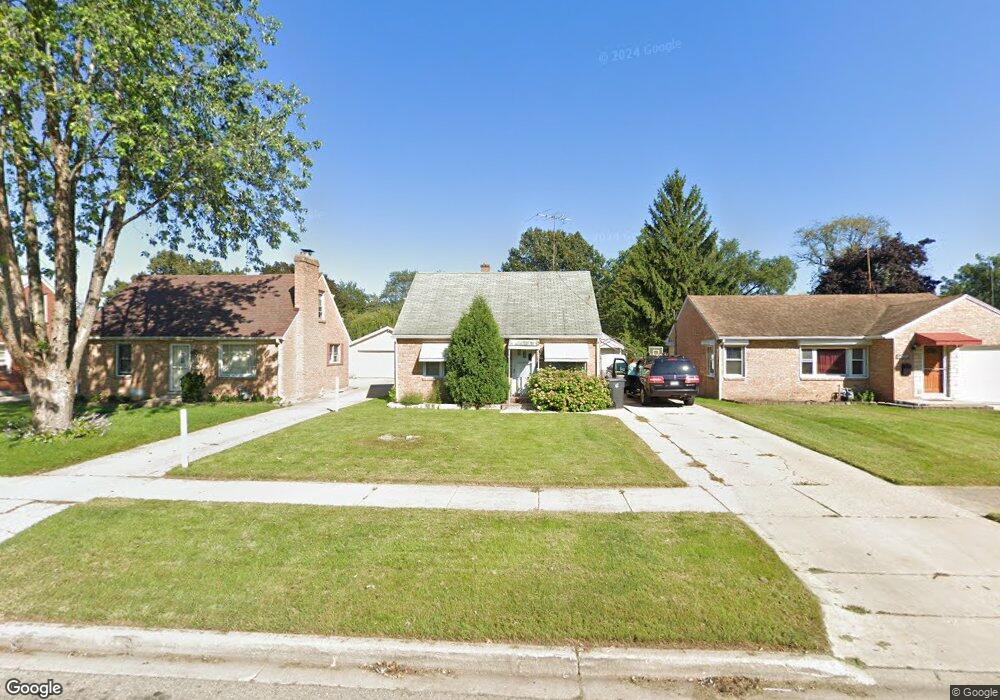
1061 N Berwick Blvd Waukegan, IL 60085
Glenwood Heights NeighborhoodEstimated Value: $219,000 - $249,000
4
Beds
1
Bath
1,176
Sq Ft
$200/Sq Ft
Est. Value
About This Home
This home is located at 1061 N Berwick Blvd, Waukegan, IL 60085 and is currently estimated at $234,800, approximately $199 per square foot. 1061 N Berwick Blvd is a home located in Lake County with nearby schools including Glenwood Elementary School, Miguel Juarez Middle School, and Waukegan High School.
Ownership History
Date
Name
Owned For
Owner Type
Purchase Details
Closed on
Oct 24, 2019
Sold by
Rise Invest Llc 630
Bought by
Castro Ivan Torres and Gonzalez Rosa
Current Estimated Value
Home Financials for this Owner
Home Financials are based on the most recent Mortgage that was taken out on this home.
Original Mortgage
$105,000
Outstanding Balance
$92,266
Interest Rate
3.65%
Mortgage Type
New Conventional
Estimated Equity
$142,534
Purchase Details
Closed on
Jun 27, 2018
Sold by
Gutierrez Manuel H Burga
Bought by
Rise Invest Llc 630
Purchase Details
Closed on
Jul 31, 2013
Sold by
Ruiz Noe and Ruiz Maria B
Bought by
Burga Gutierrez Manuel H
Purchase Details
Closed on
Sep 30, 2002
Sold by
Sposito Jeanette M J and Sposito Joseph J
Bought by
Ruiz Noe and Ruiz Maria B
Home Financials for this Owner
Home Financials are based on the most recent Mortgage that was taken out on this home.
Original Mortgage
$132,815
Interest Rate
6.13%
Mortgage Type
FHA
Create a Home Valuation Report for This Property
The Home Valuation Report is an in-depth analysis detailing your home's value as well as a comparison with similar homes in the area
Home Values in the Area
Average Home Value in this Area
Purchase History
| Date | Buyer | Sale Price | Title Company |
|---|---|---|---|
| Castro Ivan Torres | $140,000 | Fidelity National Title | |
| Rise Invest Llc 630 | -- | None Available | |
| Burga Gutierrez Manuel H | $41,000 | Greater Illinois Title Compa | |
| Ruiz Noe | $135,000 | First American Title Insuran |
Source: Public Records
Mortgage History
| Date | Status | Borrower | Loan Amount |
|---|---|---|---|
| Open | Castro Ivan Torres | $105,000 | |
| Previous Owner | Ruiz Noe | $132,815 |
Source: Public Records
Tax History Compared to Growth
Tax History
| Year | Tax Paid | Tax Assessment Tax Assessment Total Assessment is a certain percentage of the fair market value that is determined by local assessors to be the total taxable value of land and additions on the property. | Land | Improvement |
|---|---|---|---|---|
| 2024 | $3,957 | $55,808 | $10,041 | $45,767 |
| 2023 | $4,509 | $49,966 | $8,990 | $40,976 |
| 2022 | $4,509 | $52,126 | $7,976 | $44,150 |
| 2021 | $3,950 | $43,887 | $7,007 | $36,880 |
| 2020 | $3,955 | $40,886 | $6,528 | $34,358 |
| 2019 | $4,664 | $37,466 | $5,982 | $31,484 |
| 2018 | $4,362 | $33,735 | $7,622 | $26,113 |
| 2017 | $4,246 | $29,846 | $6,743 | $23,103 |
| 2016 | $4,008 | $25,935 | $5,859 | $20,076 |
| 2015 | $3,921 | $23,212 | $5,244 | $17,968 |
| 2014 | $1,933 | $13,562 | $4,996 | $8,566 |
| 2012 | $2,852 | $24,501 | $5,413 | $19,088 |
Source: Public Records
Map
Nearby Homes
- 1005 N Lewis Ave
- 1023 N Elmwood Ave
- 1038 Indiana Ave
- 12352 W Atlantic Ave
- 968 Judge Ave
- 1213 Grand Ave
- 2009 Harding Ave
- 1117 Judge Ave
- 2008 Harding Ave
- 615 Tiffany Dr
- 1504 W Glen Flora Ave
- 2813 Theresa Ave
- 2115 Lydia St
- 2207 Williamsburg Dr
- 824 N Butrick St
- 1000 Pine St
- 1105 Woodlawn Cir
- 1312 N Linden Ave
- 1109 Massena Ave
- 2810 W Atlantic Ave
- 1057 N Berwick Blvd
- 1065 N Berwick Blvd
- 1043 N Berwick Blvd
- 1105 N Berwick Blvd
- 1107 N Berwick Blvd
- 1038 Muirfield Ave
- 1102 Muirfield Ave
- 1039 N Berwick Blvd
- 1034 Muirfield Ave
- 1106 Muirfield Ave
- 1030 Muirfield Ave
- 1111 N Berwick Blvd
- 1110 Muirfield Ave
- 1035 N Berwick Blvd
- 1026 Muirfield Ave
- 1062 N Berwick Blvd
- 1064 N Berwick Blvd
- 1060 N Berwick Blvd
- 1114 Muirfield Ave
- 1102 N Berwick Blvd